Gold may be topping out. That’s what the RSI indicator says, as the dollar returns to trade along with its uptrend.
As the market increasingly begins to question whether the Fed is going to back out of the rate cuts that just a short time ago were seen as a forgone conclusion, the big question is: what will Fed Chairman Jerome Powell say in his testimony to Congress today?
We expect Powell to frustrate unrealistic market expectations. Friday’s NFP data rattled markets as investors realized there's no longer any justification for cutting rates. Also, with growing bipartisan support, Powell may want to err on the side of hawkishness in demonstration of his central bank’s independence of an overcrowding U.S. president, who breaths down his neck relentlessly to ease monetary policy.
One thing is sure: investors will be sorely disappointed about something the market has been taking for granted. The Fed is almost certainly not going to cut 50 basis points by July 31.

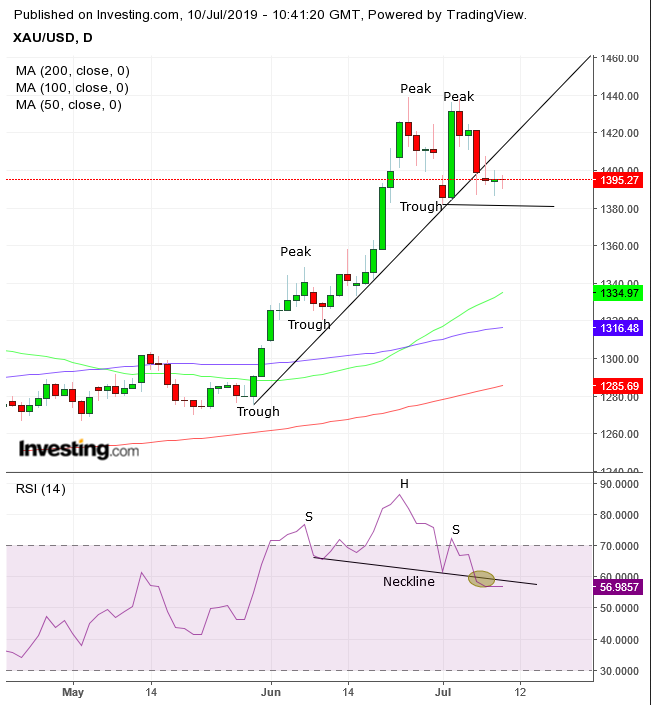
On Monday, gold fell below its short-term uptrend line since late-May. That was the first warning sign of weakness for the precious metal. If prices fall below the $1,381.91 low of July 1, it will complete a small double top. This would be the second sign of a potential reversal, measured by a descending series of peaks and troughs.
The Relative Strength Index (RSI) completed a H&S top pattern. The RSI is a momentum-based indicator, measuring the strength of price movement relative to previous strength. Since momentum leads price, the indicator signals that gold will top out as well.

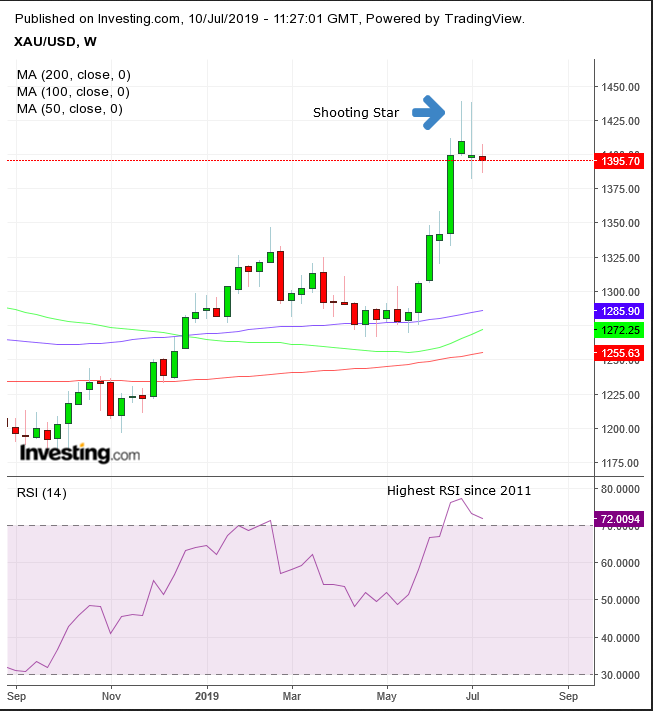
On the weekly chart, the price is falling for a second week after late-June’s bearish shooting star, suggesting the much lower close stopped out misled longs and attracted short sellers. The RSI has reached the most overbought condition since 2011.
Trading Strategies
Conservative traders would wait for a new high, for gold to resume it’s long trend, after June posted above the July 2016 high, completing an ascending long-term peak and trough formation.
Moderate traders may short after a close below $1,353, for a 2% penetration of the small double-top’s neckline, to filter out bear traps. They may wait for a return move, for an entry closer to the neckline’s resistance, if not to confirm pattern integrity.
Aggressive traders may risk a short ahead of Fed Chair Jerome Powell’s testimony and counting on the RSI’s lead to a price top.
Trade Sample - short
- Entry: $1,396
- Stop-Loss: $,1,408, above Monday’s high, when it retreated from a peak above the broken uptrend line since May 30
- Risk: $12
- Target: $1,360, above the July 1 low that forms the neckline, a potential support
- Reward: $36
- Risk-Reward Ratio: 1:3
