Breaking News
Get 45% Off 0
🌊 NVIDIA ripple effect: Track AI stocks' response to chip giant's earnings
Explore AI Stocks

Chart Of The Day: Here's Why Oil Is Still Heading To $60

By Investing.com (Pinchas Cohen)CommoditiesJun 19, 2018 10:01
ca.investing.com/analysis/chart-of-the-day-heres-why-oil-is-still-heading-to-60-200197204
Chart Of The Day: Here's Why Oil Is Still Heading To $60
By Investing.com (Pinchas Cohen)   |  Jun 19, 2018 10:01
Saved. See Saved Items.
This article has already been saved in your Saved Items
 
 
CL
-0.65%
Add to/Remove from a Portfolio
Add to Watchlist
Add Position

Position added successfully to:

Please name your holdings portfolio
 

The debate regarding which way oil is headed next rages on. The commodity's fundamentals right now are murky.

Oil could fall if OPEC's production cap is reversed later this week in Vienna and additional supply floods markets. On the other hand, it could resume its uptrend above $70 if global economic growth should strengthen or US economic sanctions against Iran and ongoing turmoil in Venezuela diminish supply.

Goldman Sachs analysts expect prices to rise to $80. They base this on an outlook for declining inventories per the global supply-demand balance, OPEC notwithstanding.

However, the Wall Street Journal yesterday published an article whose headline declared: “Ignore the OPEC Drama, More Oil Is Coming.” The piece points out the following critical point:

“…investors who are bidding up prices in the expectation of a split are misunderstanding both the history of the cartel and the current state of the oil market."

OPEC’s nonmember Russia is currently siding with Saudi Arabia about boosting output by a reported 300,000 to 600,000 barrels a day.

Yesterday’s price jump was based solely on trader expectations that the dissenters would prevail, limiting the increase.

The Journal believes prices will rise no matter what based on game theory and history. Saudi Arabia and Russia produce five times what Iran or Iraq can and 15 times Venezuela’s output, since its oil industry is in chaos. in short, no one is in a position to stop Saudi Arabia and Russia.

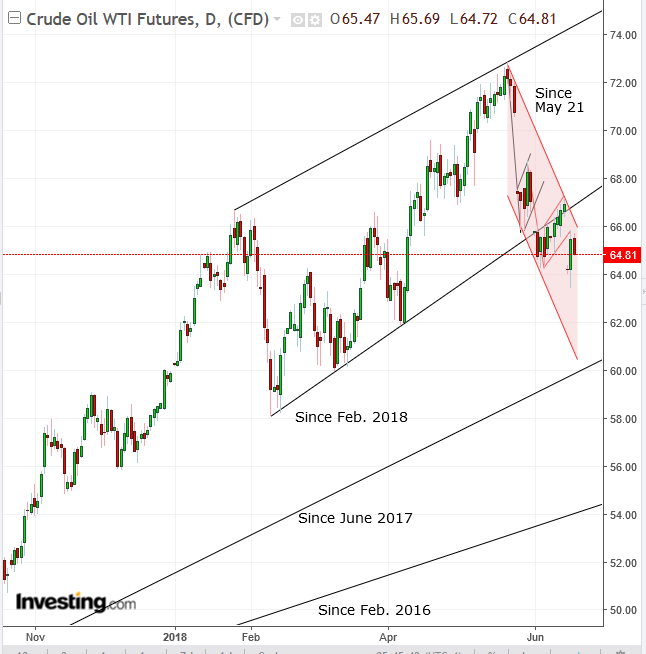
However, technical analysis tells us the supply-demand balance suggests prices will continue lower.
Oil Daily
Oil Daily

When discussing a trend, it is first necessary to establish that the language used is clear. Which trend is in question? In the case of oil there are several trends occurring at the same time. As well, they're in potentially divergent directions, based on their time frame.

While the long-term trend since the end of February 2016, as well as that since June 2017 is up, the uptrend since February is in question. The trend since May is clearly falling.

After agreeing to debate this using the same trends, we need to establish rules for what constitutes a trend, in order not to compare apples and oranges. In technical analysis, a trend is defined by the direction of its peaks and troughs. When those rise, so does the trend; when they fall, it’s a downtrend.

Patterns are interruptions in the trend that signal either a resumption of the prevailing trend or a reversal.

Last Tuesday we forecast that a back-to-back bearish flag would complete, signaling a resumption of the downtrend since May 22, under $73. The flag developed on the very uptrend line since February 11, as both trends clashed. The flag completion provided victory to the shorter-term bearish trend.

The next struggle will be at the uptrend line since June 2017, $60 at the current angle, around the very target of each individual flag. That signifies the $60 level as the current biggest supply-demand pressure point.

For traders, the most important technical trigger is that a return move to the second flag has been complete and was successful, as it demonstrated the resistance provided by the pattern. This provides a short opportunity, based on our previous post on the subject.

Chart Of The Day: Here's Why Oil Is Still Heading To $60
 

Related Articles

Frank Holmes
Gold: Is It Time for the US to Revalue Its Reserves? By Frank Holmes - Feb 24, 2025

Gold prices surged to an all-time high of $2,940 per ounce last Thursday, pushing its market cap above $20 trillion for the first time ever, as trade tensions between the U.S. and...

Chart Of The Day: Here's Why Oil Is Still Heading To $60

Add a Comment

Comment Guidelines

We encourage you to use comments to engage with users, share your perspective and ask questions of authors and each other. However, in order to maintain the high level of discourse we’ve all come to value and expect, please keep the following criteria in mind: 

  • Enrich the conversation
  • Stay focused and on track. Only post material that’s relevant to the topic being discussed.
  • Be respectful. Even negative opinions can be framed positively and diplomatically.
  •  Use standard writing style. Include punctuation and upper and lower cases.
  • NOTE: Spam and/or promotional messages and links within a comment will be removed
  • Avoid profanity, slander or personal attacks directed at an author or another user.
  • Don’t Monopolize the Conversation. We appreciate passion and conviction, but we also believe strongly in giving everyone a chance to air their thoughts. Therefore, in addition to civil interaction, we expect commenters to offer their opinions succinctly and thoughtfully, but not so repeatedly that others are annoyed or offended. If we receive complaints about individuals who take over a thread or forum, we reserve the right to ban them from the site, without recourse.
  • Only English comments will be allowed.

Perpetrators of spam or abuse will be deleted from the site and prohibited from future registration at Investing.com’s discretion.

Write your thoughts here
 
Are you sure you want to delete this chart?
 
Post
Post also to:
 
Replace the attached chart with a new chart ?
1000
Your ability to comment is currently suspended due to negative user reports. Your status will be reviewed by our moderators.
Please wait a minute before you try to comment again.
Thanks for your comment. Please note that all comments are pending until approved by our moderators. It may therefore take some time before it appears on our website.
Comments (1)
Brad Smith
Brad Smith Jun 22, 2018 12:21
Saved. See Saved Items.
This comment has already been saved in your Saved Items
Another high quality and insightful read, thanks Pinchas. It does indeed look as if the supply side will surpass the demand side even though demand has been steadily rising. Many OPEC members are speaking out against increasing oil production but they simply don't have the influence to stop Saudi Arabia and Russia. By increasing the production, Saudi Arabia and Russia will be able to capture more of the market share for themselves.
 
Are you sure you want to delete this chart?
 
Post
 
Replace the attached chart with a new chart ?
1000
Your ability to comment is currently suspended due to negative user reports. Your status will be reviewed by our moderators.
Please wait a minute before you try to comment again.
Add Chart to Comment
Confirm Block

Are you sure you want to block %USER_NAME%?

By doing so, you and %USER_NAME% will not be able to see any of each other's Investing.com's posts.

%USER_NAME% was successfully added to your Block List

Since you’ve just unblocked this person, you must wait 48 hours before renewing the block.

Report this comment

I feel that this comment is:

Comment flagged

Thank You!

Your report has been sent to our moderators for review
Continue with Apple
Continue with Google
or
Sign up with Email