Equity investors have recently had a lot to contend with: an outlook for a faster pace of tightening; an escalating trade war that could hurt US company profits; and a risk to mammoth, continuing profits from big tech firms after Facebook's (NASDAQ:FB) data breach scandal, which could herald stricter regulation for giant tech and social media platforms along with a reduction in their outsized earnings.
One noteworthy trend is the whipsawing indecision investors have displayed toward higher rates. This indecision may be a signal there's an S&P 500 top in the making—or at the very least a second leg in the February selloff.

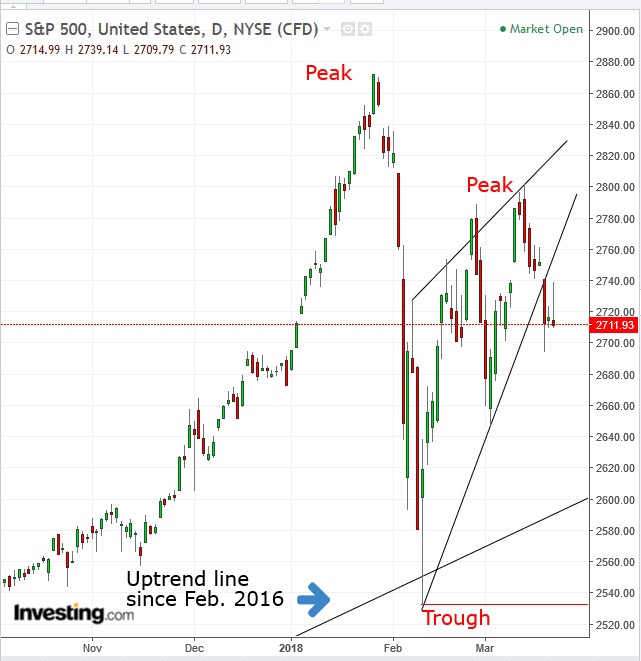
The benchmark index's price just completed a bearish Rising Wedge. The parallel rising lines may at first mark an exuberance in demand, but a supply line, via the pattern’s upper bound which keeps rising, provides bulls no real milestone, a point where they can feel they created a breakout. Demand has grown fatigued, leaving supply in charge.
To cross against a line moving in an opposite direction is much easier. This downside breakout is expected to provoke fearful longs into exiting positions, pushing the price even lower. Perhaps yet more damning, when speculators sense weakness they generally pounce, increasing their short orders.
Note that the wedge began forming after the uptrend line since February 2016 provided a support. The pattern’s breakout implies a retesting of the February low. A penetration deeper than the February 9, 2532.69 low would complete a descending series of peaks and troughs, establishing a downtrend.

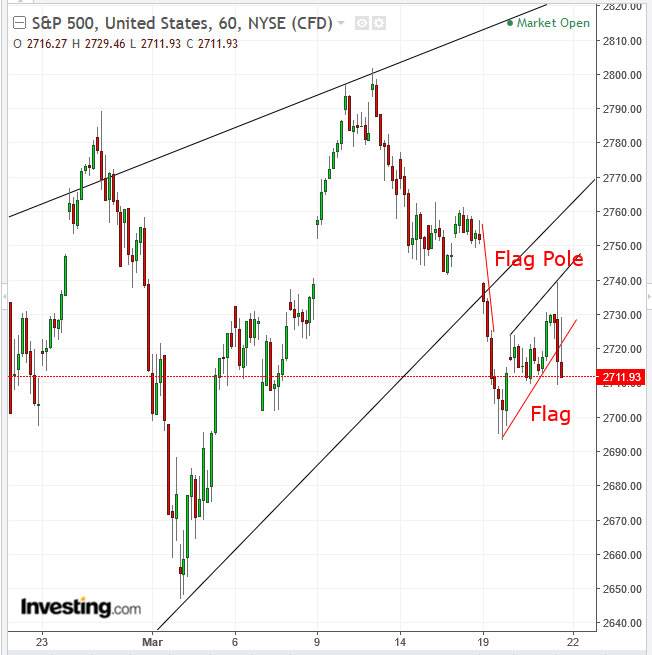
Meanwhile, yesterday’s initial rise moved lower after the dovish Fed guidance, forming a bearish Rising Flag, providing a 2,655 target and solidifying the Wedge breakout on the daily chart.
Trading Strategies – Short Position Setup
Conservative traders would wait for the main trend’s downside reversal, as described above, before shorting the index.
Moderate traders may rely on the combined bearish picture on both the daily and hourly charts but enter after the hourly Rising Flag would confirm its bearish implications, with a decline below 2710, the flag’s main congestion. Then, depending on their strategies, they might wait for a return move, either for a confirmation of its resistance or for a closer entry.
Aggressive traders may wait for an extended breakout, to avoid a bear trap, or may enter immediately, providing they can withstand a stop-loss above 2730, the flag’s lower bound, or the capital risk.
