International Business Machines (NYSE:IBM) (NYSE: IBM ) shares were sold off after its 3Q revenues came short of expectations, even after the tech giant’s acquisition of open source company Red Hat, which was supposed to boost growth.
Despite 20% growth for Red Hat in the quarter, IBM (NYSE:IBM) revenue declined 3.9%, even though it beat on earnings. Perhaps, this occurred because this is the fifth straight quarter of revenue decline, amid a global slowdown.
The stock's price is the same as it was two years ago, before these missed revenues. While that might suggest that investors are willing to look past slowing growth within a complex global environment, a longer view reveals signs of overall weakness.
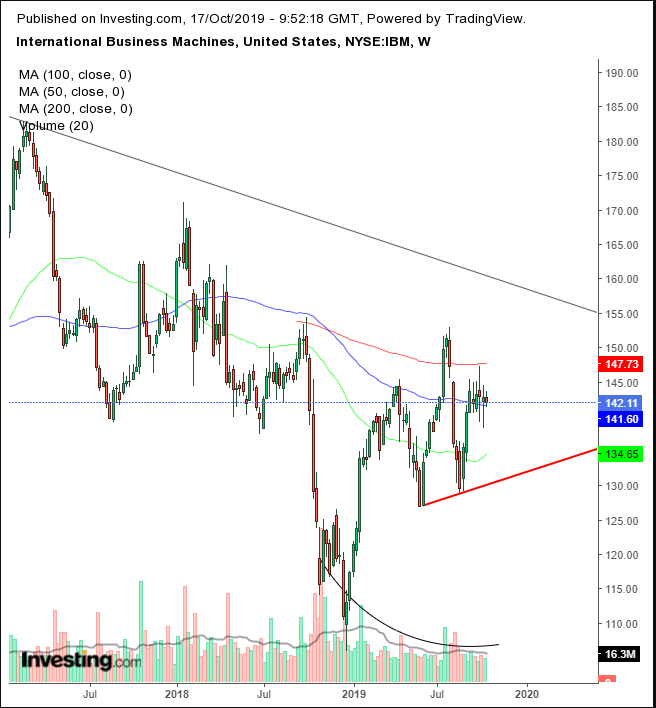
While the current price is flat when compared to two years ago, in December, the price plunged 25%. That selloff formed another trough, reinforcing the downtrend since the March, 2013 top at $216, over 70% higher.
IBM (NYSE:IBM) has been fluctuating for the past five weeks, ultimately has made no headway in either direction — as it struggles to break free of its entrapment between the 200 and 100 DMAs. The levels of fluctuation just happen to be at the same levels as those of the April highs.
If the price declines from here, it will have formed the right shoulder — at the same height as the left shoulder — of a H&S top, with the neckline connecting the May and August lows of the left shoulder and head, at $132.
As we often point out, the placement of a pattern is crucial to its interpretation. This H&S top is below the 200 DMA and the long-term downtrend line since March 2013, helping to explain why investors might want to stay away from the stock at these levels, at this time.
Note, the volume has been drying out, even amid the post-Christmas-Eve rally.
A downside breakout of the H&S pattern would imply a lower trough, extending the long-term downtrend, and boosting the U.S. slowdown story.
Trading Strategies – Bear Position Setup
Conservative traders should wait for a downside breakout, employing a minimum of a 3% and 3-day (preferably including a weekend) filter, to avoid a bear trap. Then, they’d wait for a return move, which would demonstrate resistance.
Moderate traders may wait for the pattern completion, with just a 2% penetration and a 2-day filter. Then, they may wait for a pullback for a better entry but not necessarily for trend confirmation.
Aggressive traders may short now, relying on the pattern’s momentum, the low volume, the 200 DMA and the proximity of the long-term downtrend line, after the December trough re-established the long-term downtrend.
Trade Sample – Short Position Setup