Goldman Sachs (NYSE:GS) is scheduled to release its corporate results for the fiscal quarter ending December 2018 tomorrow, Wednesday January 16, before the market opens. Consensus forecasts call for a $5.60 EPS on $7.90 billion in revenue.
The global investment bank, and its stock, has been plagued by a raft of negative headlines since news broke that two of its former bankers, along with others, were alleged to have defrauded Malaysia's 1MDB state development fund of $2.7 billion in proceeds from a bond issuance. Goldman’s stock took a beating after the news was released, dropping 2.65% that day.
Over the last few months shares declined by 18%. However, after Christmas the stock began to recover. Is it possible investors have already moved beyond the scandal?

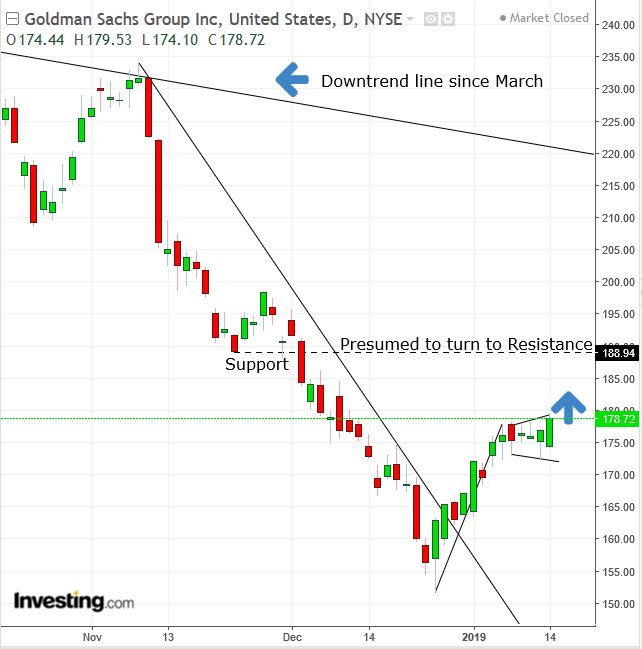
The price action suggests the stock’s fortunes are currently more tied to the broader market than to any negative publicity. Shares have bounced since the broader market's post-Christmas rally and have been trading within equilibrium since Friday before last.
The trading pattern developed a pennant shaped consolidation, a continuation pattern, completed with an upside breakout. Note, that the price move that preceded the recent range, from the low of $151.70, to the high of $178.10, posted on January 8—a gain of $26.08, or +17.19%—far outperformed the 10.6% gain in the Dow Jones Industrial Average, where it’s listed, for the same period. As well, the rebound from the pre-Christmas rout pushed prices above their downtrend line since November, something none of the major indices have accomplished.
All these factors argue for an upside breakout of the pennant, whose target may take on the $200 mark, as the pause that formed the pennant allowed for new blood to come in and repeat the sharp move prior to the consolidation.
Trading Strategies
Conservative traders would wait for the short-term uptrend to penetrate the long-term downtrend line since the record peak of $275.35 posted March 12, which, per the current angle is located at $220.
Moderate traders would wait for a decisive upside breakout.
Aggressive traders may take a long position now, relying on the bullish bias of the pennant pattern, hoping it indicates a positive earnings report. Note, a stop-loss may be ineffective during slippage.
Trade Sample:
- Entry: $180
- Stop-loss: $178
- Risk: $2
- Target: $186
- Reward: $6
- Risk-Reward Ratio: 1:3
