Get 40% Off
👀 👁 🧿 All eyes on Biogen, up +4,56% after posting earnings. Our AI picked it in March 2024.
Which stocks will surge next?
Unlock AI-picked Stocks

Chart Of The Day: Is Yesterday's S&P 500 Collapse A Buying Opportunity?

Published 2018-05-30, 10:01 a/m
Updated 2020-09-02, 02:05 a/m

The S&P 500 index tumbled yesterday, the most in more than a month. The drop was led by Financials after slipping yields suggested that rates (which are the bread and butter of banks) would not rise more than at a gradual pace, confirming the recent Fed minutes. Another headwind to the financial sector is the European debt crisis which is threatening to spread to other parts of the globe.

More bad news also weighed on US markets when the the US blindsided China by announcing it was resuming its efforts to raise tariffs on Chinese imports, restrict sensitive US technology and shorten visas for some Chinese citizens, just ten days after Treasury Secretary Steven Mnuchin said that the US and China will put the trade war on hold.

China responded that it would defend itself, threatening a counter trade-based attack.
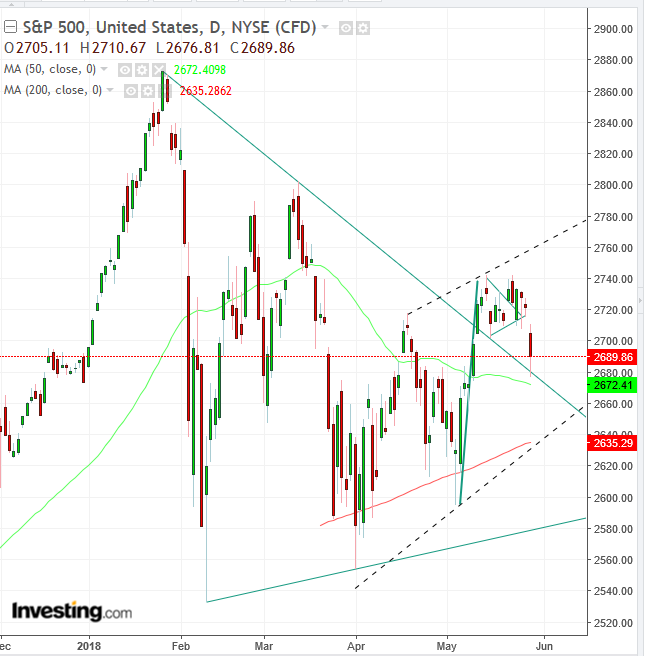
S&P 500 Index Daily Chart

Yesterday’s worst one day fall in more than a month brought the index below the upper boundary of a symmetrical triangle, nearing the 50 DMA (green). However it closed well above the pattern.

The 200 DMA (red) rushed in to aid its 'lieutenant,' the 50 DMA. While the decline may be considered nothing more than a correction, as part of a return move after a breakout, with a 1.2 percent upside penetration, it satisfied only an aggressive filter in avoiding a bull trap.

In a previous post we discussed the potential of an upside breakout to a pennant. However, it failed. So how should traders proceed from here?

Trading Strategies – Long Position Setup

3rd party Ad. Not an offer or recommendation by Investing.com. See disclosure here or remove ads .

Conservative traders would wait for a decisive upside breakout, reaching a conservative, 3 percent penetration, prior to considering risking a long position.

Moderate traders may be satisfied with closing above the 2,740 May peak, as a sign that demand absorbed all the available supply at these levels, turning resistance into support.

Aggressive traders may enter a long now, providing they can afford a stop-loss below the 50 DMA at 2,670, which proved yesterday a support (alternatively, they may wait for a dip for a closer entry), or assume the risk of losing the position.

Latest comments

Risk Disclosure: Trading in financial instruments and/or cryptocurrencies involves high risks including the risk of losing some, or all, of your investment amount, and may not be suitable for all investors. Prices of cryptocurrencies are extremely volatile and may be affected by external factors such as financial, regulatory or political events. Trading on margin increases the financial risks.
Before deciding to trade in financial instrument or cryptocurrencies you should be fully informed of the risks and costs associated with trading the financial markets, carefully consider your investment objectives, level of experience, and risk appetite, and seek professional advice where needed.
Fusion Media would like to remind you that the data contained in this website is not necessarily real-time nor accurate. The data and prices on the website are not necessarily provided by any market or exchange, but may be provided by market makers, and so prices may not be accurate and may differ from the actual price at any given market, meaning prices are indicative and not appropriate for trading purposes. Fusion Media and any provider of the data contained in this website will not accept liability for any loss or damage as a result of your trading, or your reliance on the information contained within this website.
It is prohibited to use, store, reproduce, display, modify, transmit or distribute the data contained in this website without the explicit prior written permission of Fusion Media and/or the data provider. All intellectual property rights are reserved by the providers and/or the exchange providing the data contained in this website.
Fusion Media may be compensated by the advertisers that appear on the website, based on your interaction with the advertisements or advertisers.
© 2007-2024 - Fusion Media Limited. All Rights Reserved.