- All Instrument Types
- Indices
- Equities
- ETFs
- Funds
- Commodities
- Currencies
- Crypto
- Bonds
- Certificates
Please try another search

Chart Of The Day: Italy's Fiscal Uncertainty Eases...Buy The Euro?

The euro has rebounded from a five-day selloff during which the currency slipped the most since December. Traders were unnerved by Italy's recurring fiscal woes which led to the inevitable finger-pointing at the European Union which has a 3% fiscal debt threshold for member nations. Fears began to escalate that Italy's current euroskeptic government would widen its outstanding debt for nationalistic reasons, rather than adhere to the EU's guidelines.
Despite these concerns, Italy seems to be back on track. Its government has reached a decision to keep fiscal debt within the threshold recommended by the EU. European assets immediately jumped in value in reaction to this news. Moreover, ever since 2016 when investors failed to react significantly to the risks of the Brexit vote in June and former Italian Prime Minister Matteo Renzi’s failed referendum in December, we believe that it takes a lot more to scare the market in any real way.
Following that logic, this could be the perfect opportunity to invest in the euro.

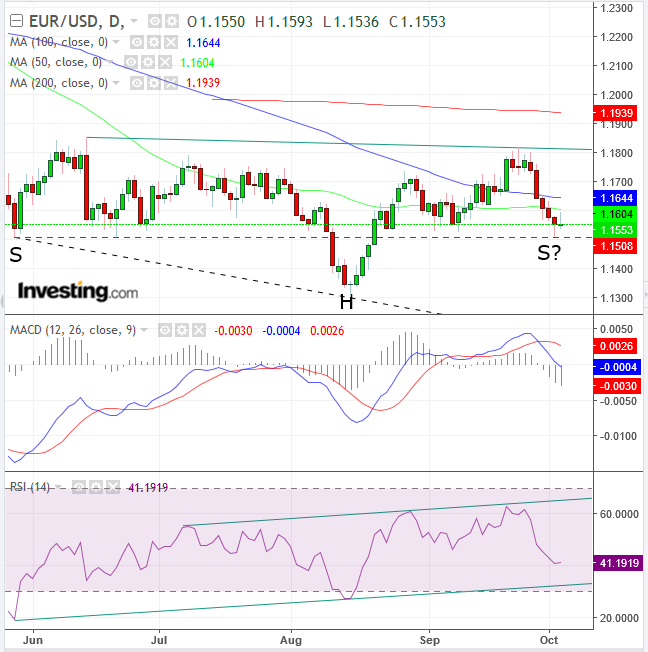
Today's rebound follows yesterday's hammer, a candle whose bullishness is expected to follow a short squeeze after the euro bounced off yesterday's lows. Moreover, the hammer's location reveals the significance of the potential support of this price level, as it aligns perfectly with the demand found in late May and late June. The support suggests a line held by demand, set to carry prices higher, forming the right shoulder of an H&S bottom.
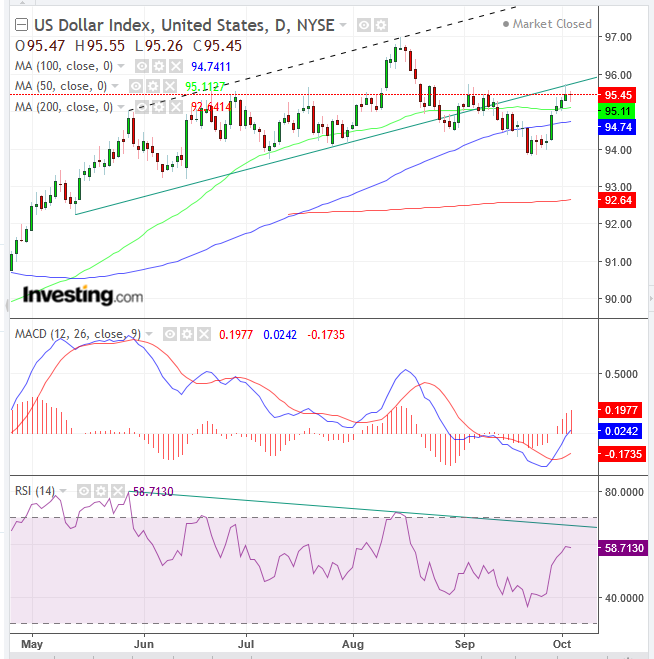
The timing for a rise in the euro is confirmed with the US Dollar Index, which found resistance by the broken uptrend line since May 14, forming a shooting star. While a hammer is expected to provide support, when losing short-sellers rush to cover shorts, a shooting hammer is a predicted resistance, as buyers' stop-losses are triggered.
Notice that the RSI of both charts provides a divergence to price. The EUR's RSI delivers a positive divergence, as momentum rises despite a falling price, suggesting price will follow. On the other hand, the RSI of the DXY provides a negative divergence as momentum is falling, as opposed to a rising price, suggesting price will follow it down.
The indicators that have not yet joined this outlook are the moving averages and the MACDs, but it is rare that all indicators line up, as they measure different aspects. Momentum is a leading indicator, in that it indicates when an expected price move is about to happen, while the MAs and MACD are lagging indicators, in that they confirm or negate a move after it happens. Therefore it’s not a red flag that these particular indicators don’t show the same picture.
Trade Strategies – Long Position Setup
Conservative traders should wait for a proper reversal, with an upside breakout above 1.1800, before going long.
Moderate traders, who don’t want to wait for the completion of the pattern, may wait for a long green candle to confirm the hammer’s base.
Aggressive traders may enter a short now.
Trade Sample:
- Entry: 1.1550
- Stop-loss: 1.1500, beneath the hammer and psychological round number
- Risk: 50 pips
- Target: 1.1800, the resistance of mid-June and mid-September peaks
- Reward: 250 pips
- Risk-Reward Ratio: 1:5
Related Articles

The US dollar has come under some pressure on the back of the rerating of the US growth outlook and expectations that the Russia-Ukraine conflict is nearing an end. However, we...

CAD While the loonie has not fully unwound the recent move lower on the back of Trump’s comments yesterday, it is notable that USDCAD has begun early trading this morning with a...

Welcome to Simply Forex This content was originally published by our partners at Simply Forex.
Are you sure you want to block %USER_NAME%?
By doing so, you and %USER_NAME% will not be able to see any of each other's Investing.com's posts.
%USER_NAME% was successfully added to your Block List
Since you’ve just unblocked this person, you must wait 48 hours before renewing the block.
I feel that this comment is:
Thank You!
Your report has been sent to our moderators for review


Add a Comment
We encourage you to use comments to engage with users, share your perspective and ask questions of authors and each other. However, in order to maintain the high level of discourse we’ve all come to value and expect, please keep the following criteria in mind:
Perpetrators of spam or abuse will be deleted from the site and prohibited from future registration at Investing.com’s discretion.