According to Dr. Muriel Jean-Jacques, assistant professor of medicine at Northwestern University, Johnson & Johnson’s newly approved vaccine has two game-changing qualities.
It's one and done, so unlike the already available coronavirus inoculations from Moderna (NASDAQ:MRNA) and Pfizer (NYSE:PFE)/BioNTech (NASDAQ:BNTX) there's no need for a second, follow-up shot. As well, in contrast to the other two vaccines, JNJ's version doesn't require specialized refrigeration such as the extreme freezers needed to store the earlier vaccines. Johnson & Johnson's (NYSE:JNJ) inoculation needs regular refrigeration only, enabling it to be delivered and administered in remote as well as urban locations around the world.
Those factors together should be enough to enhance the company's fundamentals. The drugmaker says it's on track to deliver 4 million doses this week with an additional 100 million delivered worldwide by June.
But there are additional reasons the JNJ vaccine could be a booster rocket for the company's shares. It was also found to be effective against variants, such as the South African strain, with a 64% efficacy in preventing moderate to severe diseases. The inoculation has proven to be 85% efficient against severe illness and 100% effective in preventing death. Additional studies demonstrated a 72% efficacy rate at preventing moderate to severe disease.
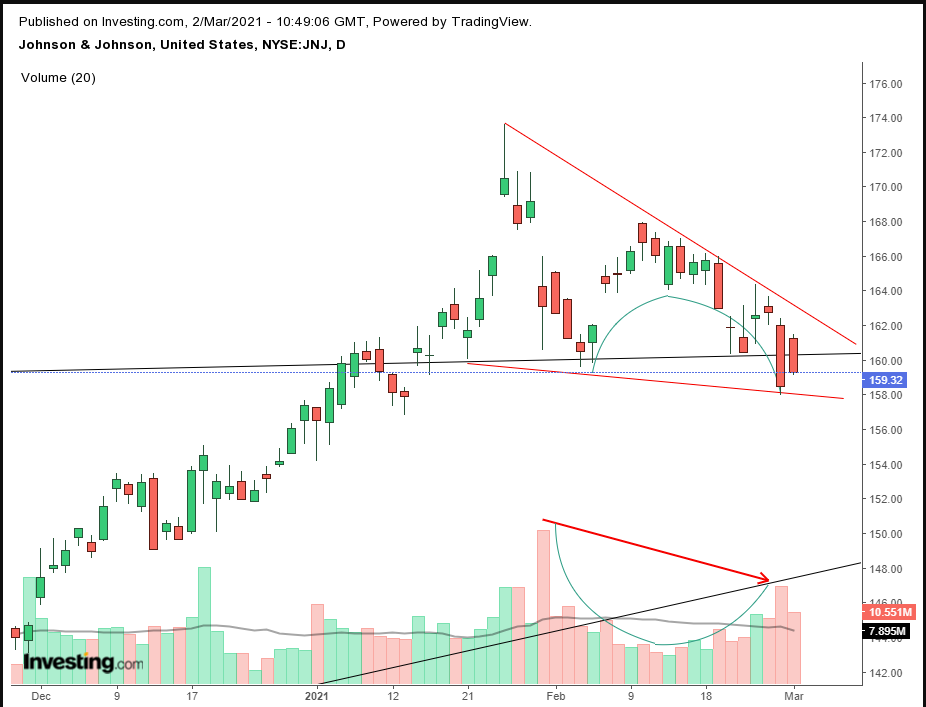
It also happens that the vaccine’s delivery coincides with a technical setup indicating the stock is about to surge.

Shares have been trading along a falling wedge pattern, when both trendlines head lower, with the upper bound falling more quickly than its lower counterpart. The pattern shows that while sellers agreed to sell at ever-lower levels, buyers held the line, keeping demand consistent, relative to the faster down sloping upper bound, the sellers’ line.
If the expectation is that the JNJ should fall, why are buyers not matching the eagerness of the sellers. If sellers are consistently compromising on their selling price, why then are buyers continually willing to pay the same price, relatively, rather than wait for the price to drop lower before investing?
Buyers obviously have a different view on the stock than the sellers. Why would that be? We presume, it's about timing.
The stock has climbed a staggering 30% in less than 3 months, from the lows of Oct. 30 to the all-time high on Jan. 28. Johnson & Johnson is not a sexy equity like Tesla (NASDAQ:TSLA) or Apple (NASDAQ:AAPL), that moves on momentum and appeals to young, retail traders. Rather, it's a traditional blue-chip, an old-timer that appeals to retirees because of its steady dividend, but otherwise tends to move slowly.
Those fortunate investors who own the stock want to cash in their winnings. They're selling their stocks, weighing the price. Buyers, however, who were not invested during that move, are presumably considering the 9% decline from the record high as a buying dip.
Notice that the volume has diminished since the initial fall from the record, suggesting this move isn’t part of the trend. Also, note that volume has mostly been in mirror image to the price action, falling when the price rises and rising when the price falls. This again shows where the impetus is—which is upwards.
Finally, the placement of the falling wedge on the chart is telling.

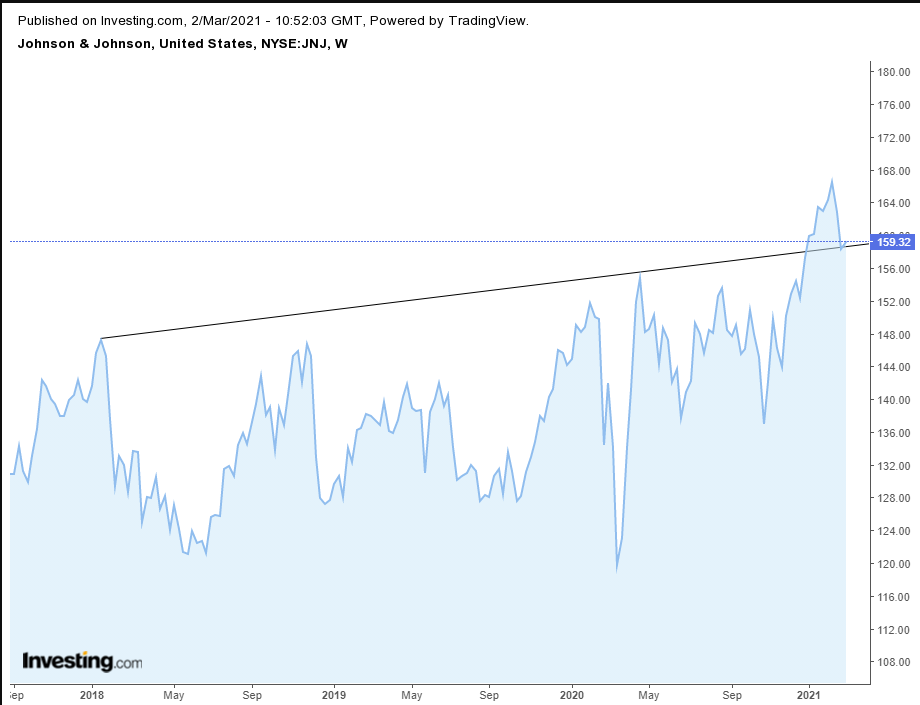
The fall came after breaking through the extreme selling line since Jan. 15, 2018. Market dynamics tend to push stocks down after an upside breakout, as the stock “retests” whether the presumed, newfound support will hold. This may be on profit taking by a combination of shorts and longs, as described above. Note, that the closing price recently rebounded just above the long-term trendline.
Note too that the wedge is not complete until it provides an upside breakout. That would demonstrate that buyers absorbed all available supply and are now willing to up their bids to find new, willing sellers above the pattern, which sets in place a rising chain reaction.
Trading Strategies
Conservative traders should wait for the price to score a new high, then buy on the dip, after finding support.
Moderate traders would buy after the price scales above the Feb. 10, $168 high, then wait for a return move for a better entry, if not for further confirmation.
Aggressive traders could go long after the price penetrates the Feb. 24 high of $164.39, provided they are trading according to a preset trading plan.
Here’s an example:
Trade Sample
- Entry: $162
- Stop-Loss: $160
- Risk: $2
- Target: $168
- Reward: $6
- Risk:Reward Ratio: 1:3
Author's Note: This is just a trading sample, meaning it isn’t the only way to approach this trade. Even if the analysis is right, the sample can lose. And the analysis could be wrong. We don’t know what will happen but are providing statistics. 92% of falling wedges break out upward (Bulkowski, 2000), but our interpretation of the pattern could be incorrect. Therefore, trading with a coherent plan helps you stay on the side of statistics. Your budget, timing and temperament will affect the results of this trade, and you should tailor a plan to your circumstances. Until you learn how to do that, trade small to learn, not to win big, otherwise you could lose big. Guaranteed. Happy trading!
