Moderna (NASDAQ:MRNA) dropped over 5% on Monday after Novavax (NASDAQ:NVAX) published data from the trials of its COVID-19 vaccine, NVX-CoV2373, stating it had a 90.4% efficacy rate in the third phase trial of a near-30,000-participant study in the US and Mexico. The vaccine also demonstrated 100% proof against moderate and even severe conditions of the virus. Finally, it showed little side effect.
The drug maker plans to apply for emergency authorization in the US in the third quarter. The company said it could produce 150 million doses per month by the end of the year.
With many countries still without the vaccine, Novavax could provide competition to Moderna’s growth. On the other hand, Moderna is well ahead of the game, having already asked US health regulators for approval to administer its vaccine on teens ages 12 to 17.
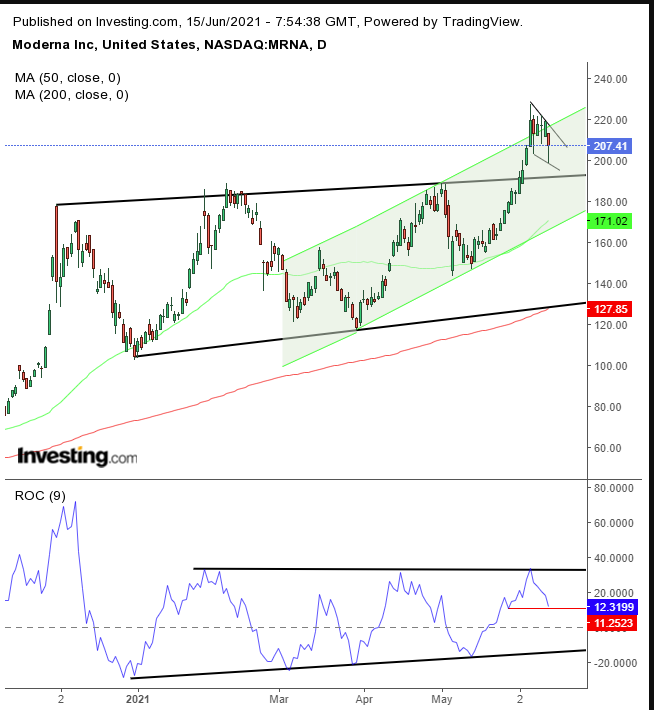
Despite the Novavax news, Moderna withstood a selloff. As we can see in the chart, while Moderna’s share slid on the announcement, the stock has pared almost twice the loss.

All things considered, when there are investors willing to buy a dip, it’s a show of strength. They’re not worried about the added competition. They believe the company would be able to maintain its growth trajectory.
The dip and the rebound extended a falling flag, particularly bullish after a 10-day advance out of 13, and an upward move of 46% from the May 19 low to the June 7 high. After such a windfall, it is understandable that bulls would want to cash in their winnings. But taking profit doesn’t mean traders are no longer bullish. They just want to lock in profits, as they catch their breath, count their lucky stars and determine whether they overdid it and if there’s more to the move.
The fact that the price does not drop sharply after such a rally demonstrates ongoing demand, as new bulls move in to pick up the slack from the early bulls. If that exchange persists, we will see the price break the topside of the flag, as the new bulls up their bids to find new stocks.
That would also be the signal that the early bulls are waiting for, as confirmation that the uptrend is alive and well, pulling them right back in. Finally, traders who were sitting on the fence 'til now recognize the pattern and join forces—with much of the market on the same side of the trade, pushing prices further up—until the next profit-take.
Note the location of the flag. It developed after the price managed to break free of a range since Dec. 1. After all that effort, we can now understand why the market needs a breather. The flag also formed at the top of the rising channel that helped it break through the top of the longer range.
The flag’s upside breakout will confirm the newfound support of the previous resistance below the psychological level around $200, which may also help the stock break through the top of its rising channel, as it assumes a steeper incline.
The 50 DMA realigned with the channel bottom, while the 200 DMA joined the bottom of the range since December—both showing where the market’s pressure points are. Having said that, we noticed that the Rate of Change failed to breakout to match that of the price. The momentum gauge’s top penetration will provide additional impetus for the move higher.
Trading Strategies
Conservative traders should wait for the upside breakout, whose penetration should exceed at least the $220 level, where the flag’s candle tops found resistance—corresponded to by the ROC breakout—followed by a return-move that verified the flag’s support, before risking a long position.
Moderate traders would wait for the penetration to rise above $217 and for the probable follow-up dip to reduce exposure, if not for further evidence of demand.
Aggressive traders could enter a contrarian, short position, given that Moderna is near the flag’s top and can fall back to the top of the range since December, if not to the rising channel bottom. While, this is a risky trade, it’s compensated with a highly favorable risk-reward ratio, if your timing is right. The riskier the trade the more paramount is a coherent trade plan that makes sense, and the more disciplined you must be to it. Here’s an example:
Trade Sample
- Entry: $213
- Stop:Loss: $215
- Risk: $2
- Target: $193
- Reward: $20
- Risk:Reward Ratio: 1:10
Author's Note: This is just a “sample.” The actual analysis is in the body of the post. If you don’t understand it and its risks and accept them, do NOT trade. We do not know the future. We are merely applying the principles of technical analysis, which are statistically based. That means that even if our interpretation is right —and it could be wrong—the market doesn’t follow through each time in the same way. Much of your trading performance will be dictated by your personal trading style. Therefore, the plan must suit your timing, budget and temperament. Trading success or failure is determined in the long run, not by a few trades, and not by aimless, planless trades. Until you develop your skills to customize your own trading plans, use ours but only for the purpose of learning, not profit, or you’ll end up with neither, nor your money back.
