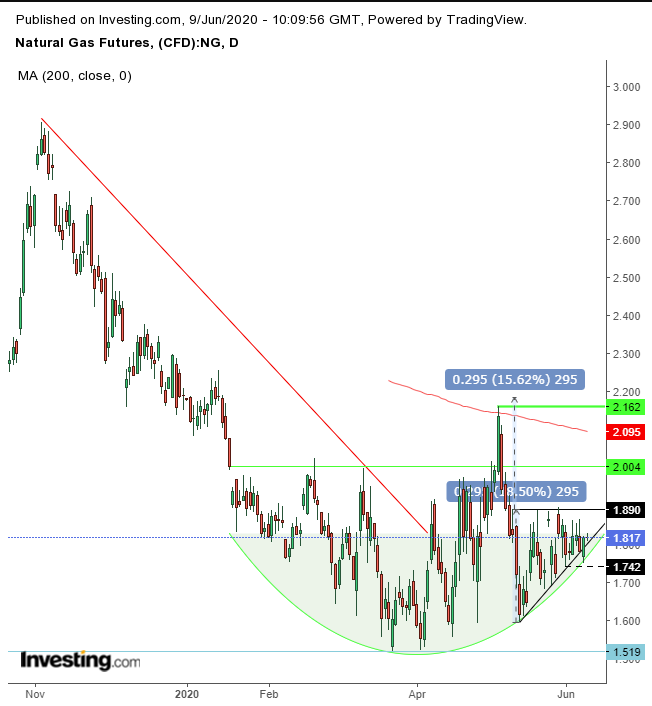
Natural Gas Futures had been ranging ahead of Tropical Storm Cristobal which hit the Gulf Coast on Sunday. But well before the coronavirus pandemic, the commodity was falling along with the rest of the energy sector. And the COVID-19 lockdown pushed prices even further—down to 25-year lows.
However, Monday’s rebound pointed at trader demand that might be sufficient to have caused the contract to bottom out.

The price has been range trading since May 11 within an ascending triangle, in which demand has been gaining on supply. The price fell out of the triangle yesterday but closed higher after wiping out the loss.
The rebound confirmed another presumed boundary of demand, that of a rounding bottom, in place since early January. It provides a symmetrical visual of how COVID-19 first spurred the fall, seen in the first part of the pattern, and after a while, as the pattern begins to rise, the end to the lockdowns coupled with the hope that the worst is over.
Strictly technically, the single day breakout on May 5 messes up what is otherwise a perfect pattern, as well as hinders deriving a precise determination to the pattern’s completion. We still expect the top of the Jan. 20 falling gap to mark the end of the bottom. Purists, however, may insist on a penetration of the May 5 high.
The implied target of the ascending triangle—if completed—is above the May 5 high, suggesting that too will come. It isn’t a foregone conclusion though that in any trade an implied target is achieved, more so when conflicting with a resistance.
Trading Strategies
Conservative traders would wait for the price to clear the May 5 high, above 2.162.
Moderate traders may rely on the penetration of the $2 level, below which prices have been hovering, save for a single day.
Aggressive traders may commit a position upon the triangle’s breakout above $1.9 or even right now, with the price being so close to the base of the two patterns—as long as the trade follows a coherent trade strategy that fits the trader’s budget and character.
Trade Sample – Very Aggressive Long Position
- Entry: $1.80
- Stop-Loss: $1.74
- Risk: 6¢
- Target: $2.10
- Reward: 30¢
- Risk:Reward Ratio: 1:5
