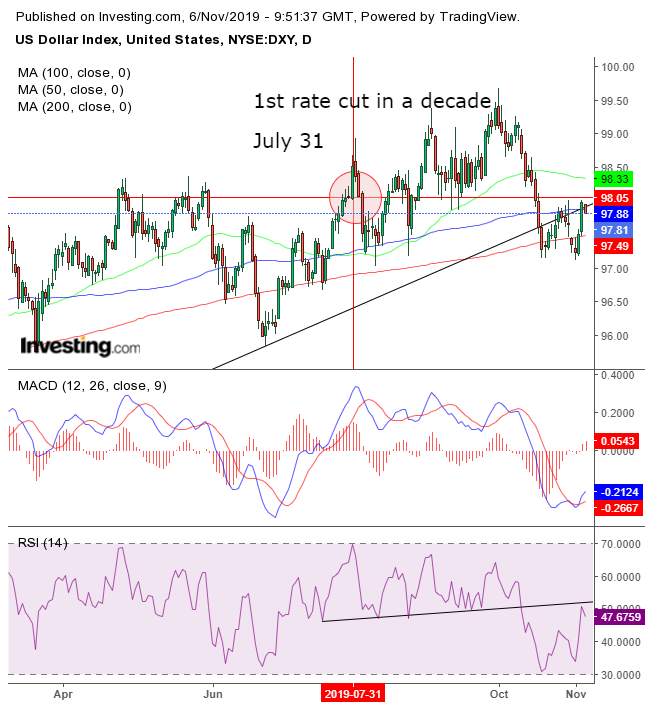
The greenback is squeezed between monetary policy and geopolitics, making it hard to work out how best to navigate through the morass of conflicting drivers. Examining the main issues, as well as the “pressure points” of supply and demand, in conjunction with the signals offered by the charts, can help provide some indication of what to expect.
The dollar retained its strength even after the Federal Reserve made a 180° turn on policy, cutting its key benchmark interest rate by a quarter of a percentage point three times since July 31, for the first time since immediately after the financial crisis a decade ago. The price at 14:00 EDT on July 31 was 98.06. It is now just 0.15% lower.
Why, then, has the dollar not weakened in tandem with its diminished yield? Because investors keep putting money into the U.S., thanks to geopolitical tensions, such as Brexit and U.S.-China trade wrangles. While the latter may be eased with a signature on Phase 1 of a resolution, thornier issues still remain for the later phases. Accordingly, the U.S. and China are likely to remain at logger heads throughout, potentially keeping the dollar propped up. Brexit, as well, remains a grave uncertainty.
Another conflict investors must manage is whether to root for a stronger economy or not. The ISM U.S. non-manufacturing PMI report rose to 54.7 from 52.6 in September, beating market expectations. On Friday, the U.S. government released a stronger-than-expected employment report. Both reports demonstrated strength in the U.S. economy, making the dollar a more desirable asset. On the other hand, that lessens the pressure on the Fed to continue an easing policy. Which will have the greater impact on the dollar?
This quandary is reflected in the chart. Here's what to look for in terms of clues of a resolution in the supply-demand balance.

On Oct. 18 the dollar index fell below its long-term uptrend line since Feb. 2018 and is now retesting its resistance for the second time. Reflecting the symmetry in the balance of supply and demand, it just so happened to be at the same level as the price when the first rate cut in a decade was made.
The opposing pressures on dollar drivers are understandable when you consider that the price is struggling on the very long-term uptrend line at precisely the same price level since the path to lower rates began, above the 200 DMA. The conflict between the broad price gauge of the MACD is also evident, suggesting the dollar is bottoming out, as is the RSI, which paints a picture of slowing momentum against the resistance of its breakoff point from the uptrend line.
This triple resistance: the uptrend line, the Oct. 30 highs and the price level when the Fed first cut its rate, set the scene for a repeat of the near-2.5% drop between the Oct. 1 peak and the Oct. 18 low more likely than a continued advance.
From a technical perspective, the two recent rallies played out the market shakedown amid an exchange of hands after the index failed to maintain the uptrend line.
Trading Strategies
Conservative traders would wait for a trend resolution — either with a new high above the Oct. 1 peak or a new low, below the Nov. 1 low. Then, they'd wait for a return move to ascertain the supply or demand integrity.
Moderate Traders may go long if the price consolidates over 98.00 or below 97.00.
Aggressive traders may short as soon as they work up a trade plan that suits their account and risk aversion.
Trade Sample – Short Position Setup
- Entry: 98.00
- Stop-Loss: 98.25
- Risk: 25 pips
- Target: 97.25, above the Oct. low's support
- Reward: 75 pips
- Risk:Reward Ratio: 1:3
Note: A trade sample does not prove that analysis or strategy is correct. Only overall success provides statistical representation.
