Though Saudi Arabia was once able to control all constituents, lately some members have become notorious for cheating on their quotas. However, at this past week's meeting, according to a Bloomberg report, Saudi Arabia fingered the cheaters and "and extracted promises that they would compensate with even deeper reductions in the third quarter."
Now, it's up to oil traders to decide whether they can trust that the newest agreement will be upheld, thereby driving the price of the commodity higher.
In the meantime, technical signals are sending a pessimistic message.

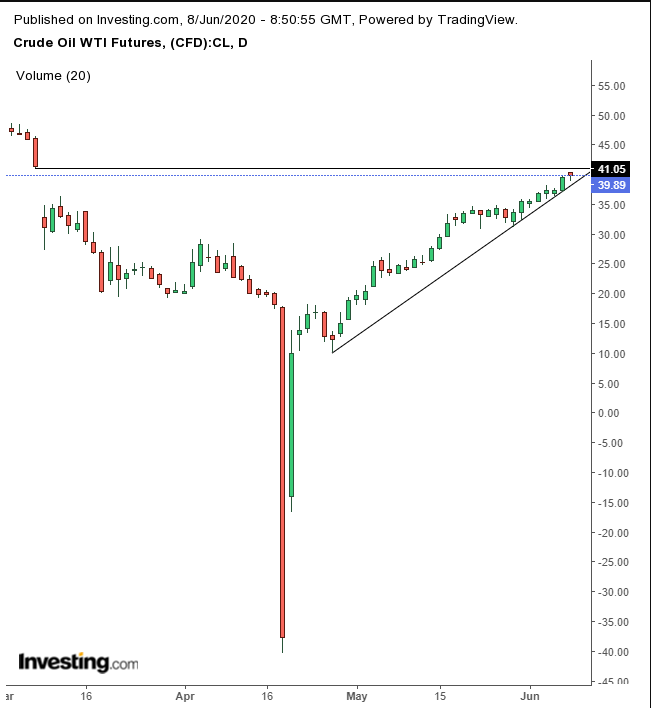
After having opened above the $40 mark, the price of oil slipped below the psychological round number. It's been struggling below it since.
Should the price close at these levels, after an earlier decline, it will have formed a hanging man, bearish with a lower candle on Tuesday.
These two resistances would solidify a presumed supply ambush at the top range of the March 9 falling gap.
Oil prices had risen well above the uptrend line between the two lows on April 28 and May 28, but have been hugging the uptrend line since. That indicates there's too much supply to allow the price to lift off easily.
Trading Strategies
Conservative traders would buy if the price accumulates above the top of the falling gap, above $41.05; or they'd sell if the price finds resistance below $30.
Moderate traders may go long similar to conservative traders, or short after a hanging man confirmation, with tomorrow’s candle falling below the real body (the price range between the open and close, disregarding intraday movement) of today’s potential hanging man. That is if the candle’s lower shadow (intraday price move below the open-to-close range) is at least twice as long as the real body.
Aggressive traders might short now, relying on the multiple resistances mentioned above, especially if they don’t believe, as equity investors seem to, that there will be a perfect Keynesian economic recovery in the second half of the year. Note: this is a contrarian, risky trade, and shouldn’t be done if you’re not prepared to lose the position. To mitigate losses, you must have a viable trading plan you can be trusted to follow.
Trade Sample: Aggressive Short Setup
- Entry: $40
- Stop-Loss: $42 – above falling gap
- Risk: $2
- Target: $35 – above May’s congestion
- Reward: $5
- Risk:Reward Ratio: 1:5
