The British economy shrank by 20.4% in April – the worst monthly contraction on record – an inevitable outcome that affected all areas of activity, after a full month in lockdown because of the coronavirus.
To appreciate the depth of the fall, it's three times worse than the contraction that ensued throughout the entire 2008-2009 economic slump. During that period, UK GDP declined by no more than 1% in a single month.
While, the worst single-month plunge is expected to be behind us, as the country eases lockdown, the UK economy will likely shrink 8% this year and is not expected to recover from the impact of coronavirus before 2023, according to Mark Gregory, EY's chief UK economist.
We anticipate it will be un uphill struggle for a country that has already been weighed down by an as-yet unresolved battle over Brexit. As well, the British pound has been falling for a third straight day, the longest losing streak for cable in a month. And technicals suggest there's more downside to come.

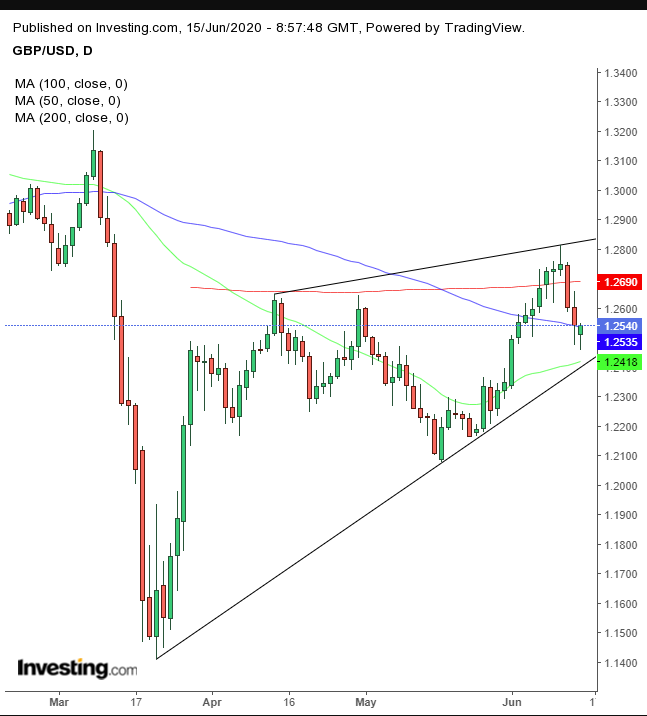
There's a rising wedge pattern forming on the charts: when highs and lows rise, but the lows go up faster.
While intuitively a bullish structure, the rising wedge implies both buyers and sellers agree that prices should head higher. But over-eagerness on behalf of buyers can leave them frustrated that sellers aren’t keeping pace, thereby allowing the price to accelerate even more quickly. Buyers reach a point at which they either have run out of capital, or motivation, thereby quashing demand.
If this scenario plays out, there would be a downside breakout, causing more buyers to give up on positions and encourage even further selling – by both original bears and tired bulls.
Rising wedges are interruptions in the trend. Therefore, a downside breakout would confirm a continued slide in the pound after the mind-boggling 12.5% plunge in just 8 sessions between March 10 and March 19, to the lowest levels in 30 years.
The rising wedge’s implied target is a retest of that 1.1409, March 20 multi-decade low. If there isn’t sufficient demand to support that price, we could expect a new wave of selloffs, which might attract traders seeking opportunities.
However, considering the price is forming a hammer on the charts, we might see another retest of the pattern top before a downside breakout. The hammer is complete only upon closing. The price may retest the bottom of the hammer at that point.
So, either allow for a wide breadth within your position, or only attempt it on the dip, knowing that that doesn’t always happen.
Trading Strategies
- Conservative traders should wait till the price dips below 1.2000, clearing the 3% minimum filter to decrease the risk of a bear trap, as well as the presumed demand waiting around the May 18 low.
- Moderate traders would wait for the downside breakout, with at least a 2% penetration, doing their due diligence to limit being caught in a bear trap.
- Aggressive traders may enter a contrarian long position, hoping to catch the bounce off the bottom of the pattern. Only traders who have a plan in place which they’re committed to sticking to, and can withstand the loss of the position, should attempt this.
Trade Sample – Aggressive, Long Position
- Entry: 1.2500 – above round number that’s higher than today’s low
- Stop-Loss: 1.2450 – 5 pips below today’s low
- Risk: 50 pips
- Target: 1.2700 – against the 200 DMA
- Reward: 200 pips
- Risk:Reward Ratio: 1:4
Which stock to consider in your next trade?
AI computing powers are changing the Canadian stock market. Investing.com’s ProPicks AI are winning stock portfolios chosen by our advanced AI for Canada, the US, and other exciting markets around the globe. Our top strategy, Tech Titans, nearly doubled the S&P 500 in 2024 - one of the most bullish years in history. And Beat the TSX, designed for broad market exposure, is showing +878% gains with 10 years’ back-tested performance. Which Canadian stock will be the next to soar?
Unlock ProPicks AI