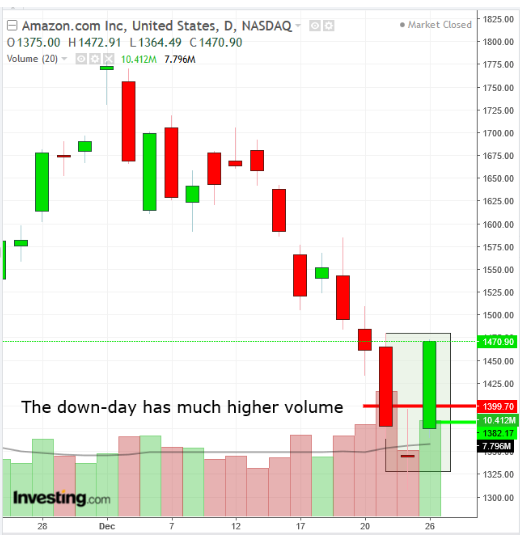
Earlier this week, Amazon (NASDAQ:AMZN) reported it had a record-breaking holiday shopping season. Yesterday, amid broader market exuberance, the stock jumped 9.59 percent to close at $1470.90.
Nonetheless, now is not the time to make a bet on Amazon shares. The stock, along with the rest of the market, remains in a downtrend, on the cusp of a bear market. And bear markets typically happen before a recession. Considering that Amazon might be regarded as a proxy for consumer spending—a critical component of US economic growth, making up 65% of the country's GDP—a slowing economy won't be beneficial for the company's customer base, or its shares.
In short, we’re not buying into this rally, however powerful it may appear to be. Earlier this week we predicted there would be short-term rally before additional selling kicked in. We also believe this is the last gasp before the more air goes out of the supply-demand balance.

Amazon surged 9.45% to complete a morning doji star. A morning star is a bottom reversal pattern. It includes three sessions, with the first being an extended red candle, projecting bearish dominance. The second develops a small real body that doesn’t touch the prior real body. We’re not concerned about intraday prices, only the open-to-close range. The small body demonstrates that bears are losing steam. Finally, a green candle that deeply encroaches deeply upon the first session’s long, red candle.
The fact that the middle session is a doji – itself a reversal candle – only reinforces the pattern. Finally, not only does the green candle of the third session penetrate the first session’s red candle, but it completely engulfed it, itself a bullish pattern. In other words, this particular morning star actually includes three reversal signals. But we are still not buying into it. Why? Eight reasons:
- Amazon’s stock is in a bear market, having fallen 34.10% since its September 4 record high.
- As mentioned above, it’s in a downtrend.
- It remains in a falling channel since October. The current rebound followed the morning star's doji, which found support at the bottom of the channel, suggesting this rally is part of a correction, rather than the main move.
- The 100 DMA is adding resistance to the channel top, demonstrating its technical significance.
- A Death Cross was triggered.
- The Death Cross itself acted as a resistance twice this month.
- The RSI provided a negative divergence, when it failed to cross over its failed uptrend line.
- Finally, despite the ferociousness of the rally, and while volume was high, it was markedly lower than that of the red candle, when bears were in charge. This diminished volume suggests there is, after all, more supply than demand.
Ideally, we’d love to see a rally to the channel top, at the $1,700 level. That would present an attractive short position.
Trading Strategies
Conservative traders would wait for the price to retest the channel top before shorting the stock, with at least one long red candle engulfing a green or small candle of either color. Then, they’d wait for the price to retest the resistance, for an entry closer to the stop-loss, reducing exposure and increasing the risk-reward ratio.
Moderate traders may short earlier, perhaps by the $1,630 level of the 50 DMA. They could wait for a fuller return to the channel top and either short immediately or wait for a demonstration of resistance. Unlike conservative traders, they may forego waiting for the resistance retest, as it might never happen, and they’d end up missing the trade.
Aggressive traders may want to jump in for a long position in order to catch the rally, but we’d recommend waiting for a potential retest of the morning doji star’s support, toward the $1,300 level, even if it means risking the rally. It’s one thing to be aggressive, going against the main trend, if the potential reward compensates for and justifies the risk. It’s another thing entirely to throw caution to the wind, losing your trading capital in the process. You may get lucky once or twice, but statistics will catch up with you.
