With three weeks left ahead of the US election in November, analysts at Goldman Sachs, UBS Asset Management, and Invesco are all forecasting a lower US dollar. The reason? Rising favorability polling numbers for Democratic presidential candidate, former Vice President Joe Biden versus the incumbent, Donald Trump.
Of course, it bears reminding that ahead of the 2016 election, polling favored Hilary Clinton and we all know how that ended—to the shock of many, then-candidate Trump won. Moreover, ahead of that election four years ago, there was strong consensus that said should Trump take the White House there would be a market collapse of proportions previously unseen.
That also proved to be wrong. Indeed, in many ways we've been seeing an incomparable market, one that has already enjoyed historic gains.
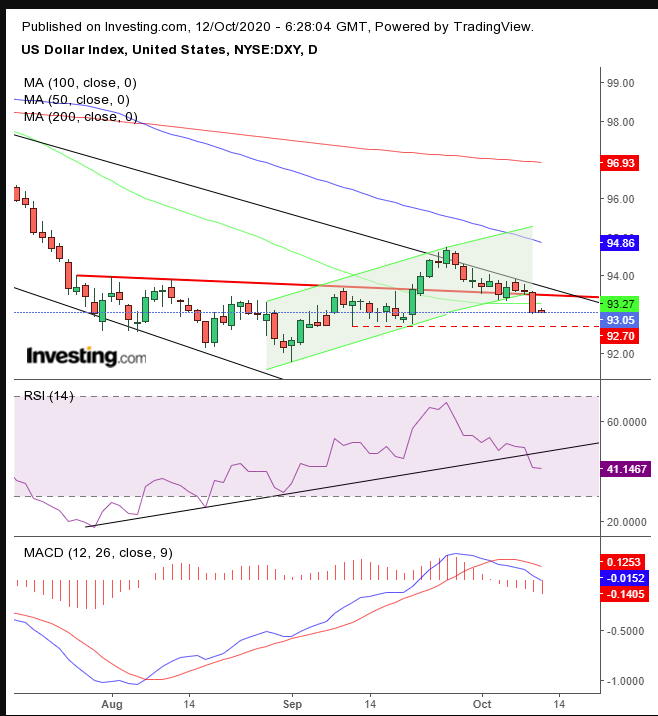
While we can't know what the future holds, neither for equities nor for the USD, we do know what the balance of supply and demand on the Dollar Index chart now indicates. Its trajectory is slowing, suggesting the dollar will weaken.

The Dollar Index has blown out a bottoming pattern. The base should have reversed the dollar’s uptrend, but the fact that the pattern specifically failed on Friday is meaningful.
The reason? Traders at those price levels refused to be locked into positions over the weekend. That expresses a lack of faith in the asset—or in dollar-denominated Treasuries by foreigners who need the local currency to puy the sovereign bonds. Also, Friday’s selloff developed a solid candle, demonstrating single mindedness. Plus, it was the longest candle since late August to boot.
A failed bullish pattern flips market mechanics and becomes a bearish pattern as traders rush to unwind positions and get into the right side of the trade. Moreover, the greenback is now anticipated to resume its underlying medium-term downtrend since the March highs.
Both the RSI, a momentum-based indicator, and the MACD—a price-based indicator—provided bearish signals.
If the Sept. 1 low of 91.75 fails to support the price, bears will have paved a path to the 2018 lows at the 88.00 levels. This, incidentally, is the target price from Goldman Sachs should a “blue wave” sweep the election and progress on the development of a vaccine occur.
Trading Strategies
Conservative traders should be patient and wait for additional penetration into the base to clear away demand, in order to avoid a bear trap. A close below the 93 lows of September, over a three-day period and preferably over a weekend would demonstrate that. Then they’d wait for a potential bounce to short.
Moderate traders are likely to wait as well, for a close below 93 to filter out remaining demand over a period of two days. They, too, could wait for a corrective rally, for a better entry if not for trend confirmation.
Aggressive traders may short now, provided they understand that the less-than-0.5% neckline penetration may prove a bear trap, and write a trading plan they commit to accordingly. Here’s an example:
Trade Sample – Aggressive Short
- Entry: 93.50
- Stop-Loss: 94
- Risk: 50 pips
- Target: 92
- Reward: 150 pips
- Risk:Reward Ratio: 1:3
Author's Note: This is a trade sample, not a full analysis. That’s in the body of the post. If you just read the sample you won’t understand the trade. A sample is just one way to do something, but not the only way. We also don’t claim to know what will happen. We’re simply playing the odds, based on our interpretation. Our education and experience suggest that a failed bullish pattern often turns bearish and that pockets of supply and demand surrounding meaningful technical price levels provide support and resistance, plus that an asset trades along its trend. However, trends end, as will this one, and for all we know it could be now. As we said earlier, we’re just playing the odds.
Which stock should you buy in your very next trade?
With valuations skyrocketing in 2024, many investors are uneasy putting more money into stocks. Unsure where to invest next? Get access to our proven portfolios and discover high-potential opportunities.
In 2024 alone, ProPicks AI identified 2 stocks that surged over 150%, 4 additional stocks that leaped over 30%, and 3 more that climbed over 25%. That's an impressive track record.
With portfolios tailored for Dow stocks, S&P stocks, Tech stocks, and Mid Cap stocks, you can explore various wealth-building strategies.
