Canadian Dollar, Oil Break Out To The Upside
On Tuesday, oil provided an upside breakout to a range since early November. Yesterday, the Canadian dollar provided an upside breakout (a downside breakout for USD/CAD) to a range of its own, since late October.
The loonie and oil are positively correlated, as the price of oil affects the exchange rate of the CAD. As an oil exporter, importing countries buy Canadian dollars with which to pay for oil; the higher its price, the more CAD they need to buy for the same amount of oil, whose higher demand will absorb the available currency at current price levels, forcing buyers to up their bids to find willing sellers.

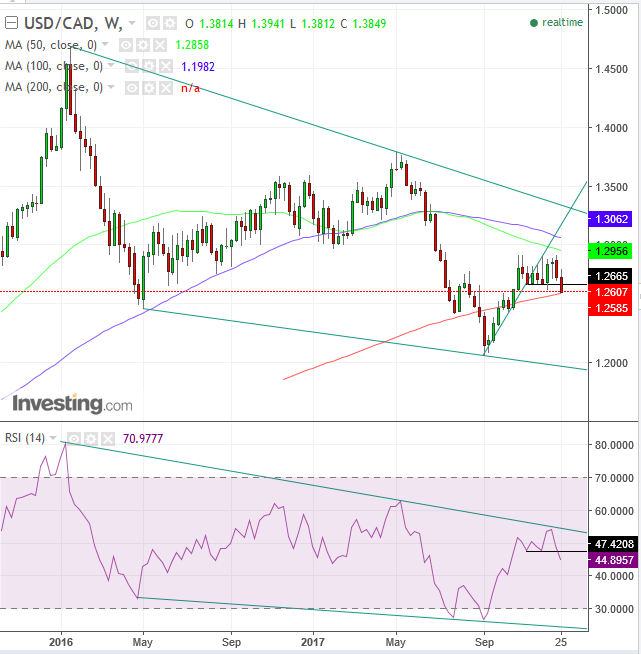
The pair has been trading in a downtrend since mid-January 2016.
This week, USD/CAD is set to provide a downside breakout of a range since late October. It is finding support on the 200-week MA (red), for now, while the 50-week MA and 100-week MA provided resistance on top of the range. An extended downside breakout below the 200-week MA would signal an end to the interruption to the prior downtrend, eyeing the 1.2000 level.
The RSI provided a downside breakout to a range of its own, upon reaching its channel-top, suggesting the price has gone as high as it would within its falling channel.

The pair completed a trip-top reversal in the midterm, aligning with the long-term downtrend since mid-January 2015.
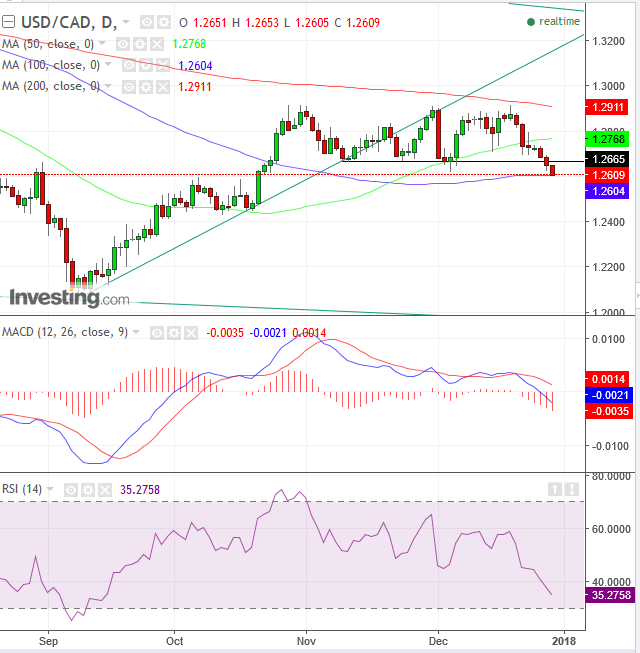
The price crossed below the 50 dma (green) for the first time since May 24, form which the price continued to decline from 1.3493 to 1.2059 registered on September 8 (1,434 pips, or 10.7 percent) in three-and-a-half months. Today’s extended breakout from yesterday is being supported by the 100 dma (blue), while the 200 dma (red) aligned with the resistance – and therefore its validity – of the range-top.
Both the MACD and RSI are falling.
USD/CAD's Two-Fold Dynamic
In addition to the direct fundamental and technical causes for a rise in the CAD, the USD/CAD enters a very interesting, two-fold dynamic:
The first dynamic is that of the USD/CAD "vicious cycle." The weakening USD raises demand for dollar-priced oil. This results in increased demand for CAD to pay for its oil exports. This then requires the selling of dollars with which to buy CAD, therefore weakening the dollar.
The second dynamic at play is the rising oil price which compounds the rate of the vicious cycle.
Our forecast is that oil will rise to $62 within the next two months.
Trading Strategies – Short Position
- Target: 1.2415
- SL: 1.2701
- Entry: 1.2620 and above satisfied 1:3 RRR
Conservative traders would wait for an official trend reversal. While the downside breakout formed a succession of lower troughs, it has yet to post two rising peaks. That would be established after another rise and fall. A rise for the second peak and a fall to render it a peak (as opposed to mid-rally).
Moderate traders would wait for a close below the 100 dma (blue), currently plotting at 1.2604, followed by a return-move confirming the resistance of the pattern’s bottom with a down-day close lower than the preceding up-day’s candle’s real body.
Aggressive traders may wait for a close beneath 1.2600 and enter an immediate short, if they can withstand a return-move or assume the risk.
