Stocks are taking it on the chin from all corners.
In geopolitics, the ever-present U.S.-China trade worries and slowing growth in Europe and China are weighing on the broader market. Fundamentally, rising interest rates could slow growth, while a flattening Treasury yield curve signals an impending recession.
Some of these drivers are more psychological than fundamental and therefore fluid, such as trade tensions. Should President Donald Trump decide to take a sharp turn, a sudden agreement would almost certainly reawaken animal spirits in the markets. The Federal Reserve has signaled it would slow down its path to higher interest rates, which we have been arguing is the primary driver among institutions, not the overhyped trade war. Finally, an agreement in which Trump can boast of his negotiating prowess may take stock prices to new heights.
It's true that we're late in the business cycle and that the arguably most extended bull market in history is already pushing it, as signaled by the flattening yield curve. But it historically takes a year or two for a recession to rear its ugly head, suggesting there is still life in the current bull market.

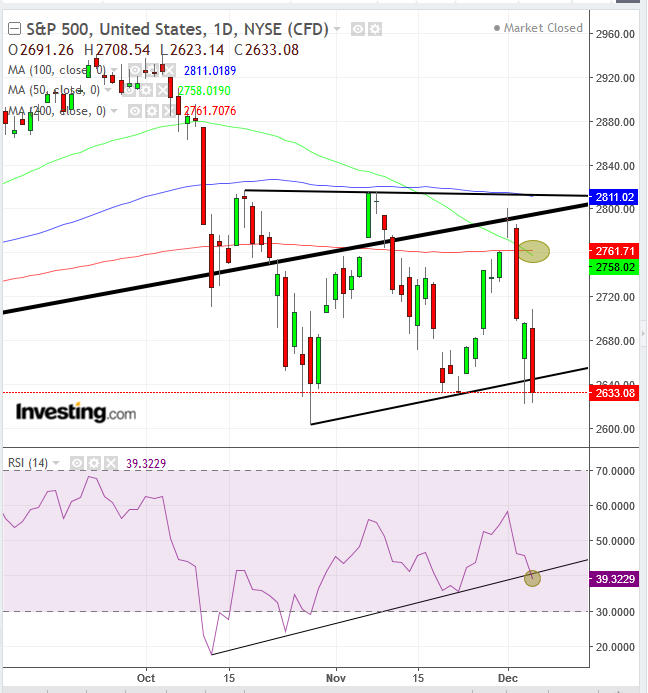
The balance of supply and demand has been weighing on the side of the bears, as well. The price fell below its uptrend line since the bottom of the last correction in February 2016. The 50 DMA (green) crossed below the 200 DMA (red), executing the ominous-sounding Death Cross, demonstrating diminishing prices overall. Finally, Friday’s close was below the consolidation since mid-October, bearish after the double-digit drop in October. The RSI, too, fell below its uptrend line, suggesting momentum is weakening.
Still, the penetration below the pattern is less than 1%, classic for a bear trap. The RSI is just peaking. It may not like what it sees and return above its uptrend line, as fickle investors may determine risk is to the upside. Finally, the Death Cross is a lagging indicator and can as easily resurrect.
Bottom line, trading is a process of weighing the evidence and quantifying probabilities.
Trading Strategies
Conservative traders should wait with a short order for a minimum 3% downside breakout and three days -– preferably including a weekend -- in which the price remains below the pattern to avoid a bear trap. Then, they’d wait for a likely return move to retest the pattern’s integrity, with at least one long, red candle, engulfing a preceding green or small candle of any color.
Trade Sample:
Entry: 2,600 after first falling to 2,560 to satisfy a 3% penetration.
Stop-loss: 2,650, above the pattern’s downside breakout.
Risk: 50 points
Target: 2,450, the round number above pattern's implied target.
Reward: 150 points
Risk-Reward Ratio: 1:3
Moderate traders may short after employing a 2% for the downside breakout. Then they may wait for a potential return move for a better entry, but not necessarily to retest the resistance.
Trade Sample:
Entry: 2,600 after first falling to 2,590 and fulfilling a 2% filter.
Stop-loss: 2,650 above the pattern’s downside breakout.
Risk: 50 points
Target (NYSE:TGT): 2,450, the round number above pattern's implied target.
Reward: 150 points
Risk-Reward Ratio: 1:3
Aggressive traders might take a contrarian long position on the hope of a bounce and justifying the higher risk to a more favorable risk-reward ratio since the price is near the support.
Trade Sample:
Entry: 2,625, around the current price of its futures contract.
Stop-loss: 2,620, below Thursday’s low price.
Risk: 5 points
Target: 2,700, psychological round number.
Reward: 80 points
Risk-Reward Ratio: 1:16
