Shares of Zoom Video Communications (NASDAQ:ZM), the stock that perhaps best represents the COVID-driven, stay-at-home environment that's dominated market sentiment for the past almost-nine-months, dropped 5.8% on Friday, pressuring the shares down 19.3% for the week.
After the stock's nearly 600% gain since the start of the pandemic, which bullishly boosted the company, its product and its shares, the recent tumble now takes it into a bear market, since it's shed 29% of value since its Oct. 19 record close of $568.34. The move exemplifies the recent investor disenchantment with overly expensive tech shares, in favor of industries that were more sensitive to the coronavirus economic cycle.

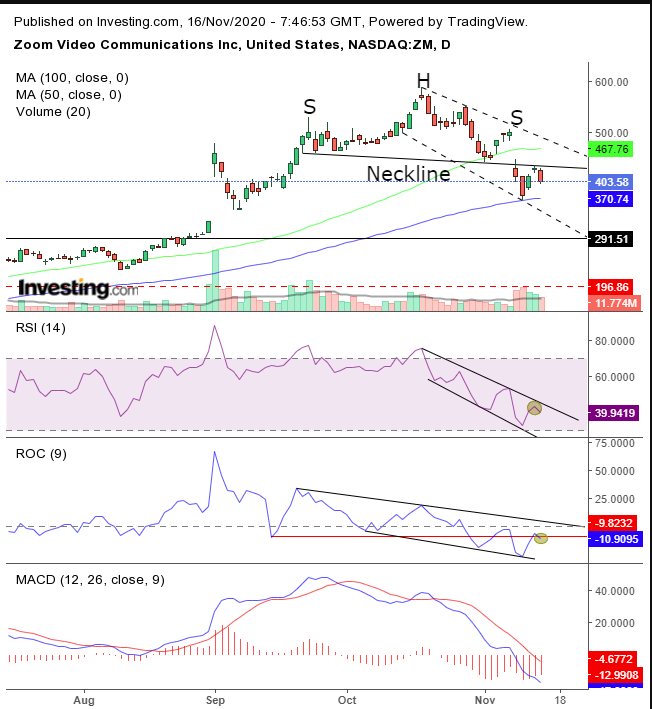
Zoom completed an H&S top with a falling gap for the downside breakout—indicating it's a price area that everyone wants to sell out of but which no one wants to buy into. While an H&S top happens when an uptrend reverses, the gap shows how deep the panic is.
Notice that on Thursday the price retested the neckline, where the lows of the top meet, and found resistance, showing there's plenty of supply at these levels, which then pushed prices even lower on Friday.
The RSI curved down having neared the top of its falling channel. Another momentum indicator, the ROC, found resistance at its Sept. 15 low, before the top’s development. At the same time. the MACD has been falling hard with no sign of a slow-down.
Meanwhile, with the pattern's downside breakout, the price cut through the 50 DMA. This was backed up by the highest volume since Sept. 23 when the pattern began developing—till it found support at the 100 DMA. The neckline’s proven resistance is expected to give it power to overtake the 100 DMA. At that point bears will then take aim at the 200 DMA. And here's where it really gets interesting.
Notice how the 200 DMA is aligning with the price area of the June-August congestion. This means there is a lot of interest in those price levels, potentially creating a support on the way down. Finally, measuring the H&S top to those levels provides the projected target for additional declines, by about $150, from the point of breakout, which brings the price back to the same price levels.
Traders may recognize what they believe as an Evening Star—a three-candle bearish pattern—that developed from Wednesday through Friday; note, however that it would only be a meaningful signal if it followed a rally.
Trading Strategies – Short Setup
Conservative traders would wait on a short for the price to return toward the top of its falling channel, something it could always do, increasing exposure.
Moderate traders may be content with the price nearing the neckline, for an entry closer to its presumed resistance.
Aggressive traders may short at will—provided they have a plan in place. Here’s an example:
Trade Sample
- Entry: $405
- Stop-Loss: $430
- Risk: $25
- Target: $305
- Reward: $100
- Risk:Reward Ratio: 1:4
Author's Note: This sample is just an example of a viable trade, based on our interpretation. Keep in mind though that trading doesn’t take place in a vacuum. Your budget, timing and temperament play a key role in your success. Know your level of risk aversion and patience for the potential reward, relative to your capital, then trade accordingly.
If you don’t know how to do that, practice with small amounts with no expectation other than to learn. If that doesn’t appeal to you, don’t bother trading. You can NOT become rich fast, and anyone who tells you otherwise is hustling you. Good trading!
Which stock to consider in your next trade?
AI computing powers are changing the Canadian stock market. Investing.com’s ProPicks AI are winning stock portfolios chosen by our advanced AI for Canada, the US, and other exciting markets around the globe. Our top strategy, Tech Titans, nearly doubled the S&P 500 in 2024 - one of the most bullish years in history. And Beat the TSX, designed for broad market exposure, is showing +878% gains with 10 years’ back-tested performance. Which Canadian stock will be the next to soar?
Unlock ProPicks AI