Even as COVID-19 ravages the global economy and fatalities world-wide continue mounting—heading toward 300,000 currently—the market narrative has been that the US, along with other countries, will see a V-shaped recovery, an immediate pick-up in growth, based on the powerful rally since the March bottom that's driven equities higher. But a new picture has begun to emerge in which those stock market moves may have been nothing more than a dead cat bounce.
Pessimistic Fedspeak, a brewing renewal of the Sino-US trade war and the realization that COVID-19 may even be here to stay are dispelling the fantasy that the March bottom was the low point.
Though we've often referred to the S&P 500 Index in recent analyses, for example here and here, today's post will take a look at the Dow Jones Industrial Average, which has been trading along the same patterns.

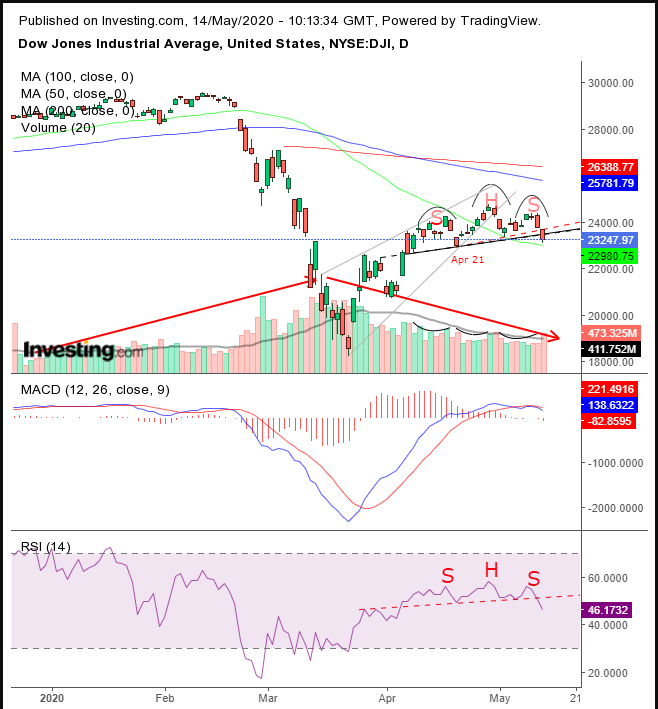
The DJIA has completed a H&S top, intertwined with a rising wedge (grey lines). Both are bearish, reflecting a shift is occuring between demand versus supply.
Does that mean technical analysis knows something before it occurs? Not at all.
But it may signal something before it becomes news. While the herd (aka dumb money) might have believed that since the March lows everything would be hunky-dory, institutions (aka smart money) were likely not nearly as exuberant.
Even before Federal Reserve Chair Powell's blunt comments yesterday that the current outlook is “highly uncertain and subject to significant downside risks,” Fed members have been trying to stanch bullish risk appetites. Therefore the price action, volume and momentum form a mirror of the market with a message that goes something like this: 'see what you’re doing? It isn’t rational.' Though reversals didn't occur when negative news hit, there's clearly increasing weakness visible throughout, for all those measures. And the downside breakout is the tipping point.
A rising wedge occurs when investors increase demand while the advance slows, until interest is exhausted, removing the floor that held up prices. The H&S top demonstrates that demand prices are no longer able to maintain the rally. Thus the lows fall back to prior lows and the final peak is unable to make new highs.
Volume provides the same picture, creating a negative divergence with prices, showing waning interest with each upmove—of the rising wedge as well as each peak within the H&S top. Conversely, volume rose with each dip, showing where the power may have actually been...meaning to the downside.
Note the overall volume performance. It rose during the plunge but after the initial spike it dissipated, even as the market continued to advance—thus the dead cat bounce which proved to be a lift-off on fumes.
The MACD’s short MA crossed below its long MA, showing that the decline is not relegated to just the last couple of sessions, but is reflected also in a wider range of price averages.
The RSI formed its own H&S, demonstrating that momentum is mirroring price, to the downside.
Author's Note: These are not normal times. Even before the worst pandemic in 100 years went viral, the market has been undergoing historic changes at increasing rates. No one really knows what happens next, including us. We're simply reading a map and plotting a course. The tricky thing right now is that the map keeps changing. As such, all we could do is change course with it.
Technical analysis is more of an art than a science. And, as we have seen during the coronavirus crisis, even science is open to interpretation. Our interpretation of the charts is not necessarily correct. The dotted red line shows a steeper neckline, starting from the April 21 low. We decided on our neckline, by finding the previous resistance that most closely lined up with our pattern's support—along the dotted line that marked the highs of late-March. But that’s just our interpretation.
Trading Strategies
Conservative traders would wait on a short for a close below 22,700, with a three-day filter, preferably to include a weekend, during which time the price doesn’t rally back above the neckline. Then, they’d wait for a likely return move, to retest the neckline’s resistance.
Moderate traders are likely to be ready for a short with a close below 23,000, with a two-day filter. Then, they’d probably wait for a corrective-rally for a better entry, not necessarily for confirmation of reversal.
Aggressive traders may short now, if they drew the line from April 21, where the price already fell more than the 1-percent minimum filter.
Trade Sample
Entry: 23,500
Stop-Loss: 24,500 – above the right shoulder’s presumed resistance
Risk: 1000 points
Target: 20,500
Reward: 3,000 points
Risk:Reward Ratio: 1:3
Note: The trade sample is just that – an example. We are showing the components of a coherent trade plan. Not every trade is right for every account and temperament. Not every trade can win. Feel free to change the parameters to personally suit your risk tolerance, and only enter a trade you’re willing and able to lose, while keeping enough capital for more trading opportunities.
