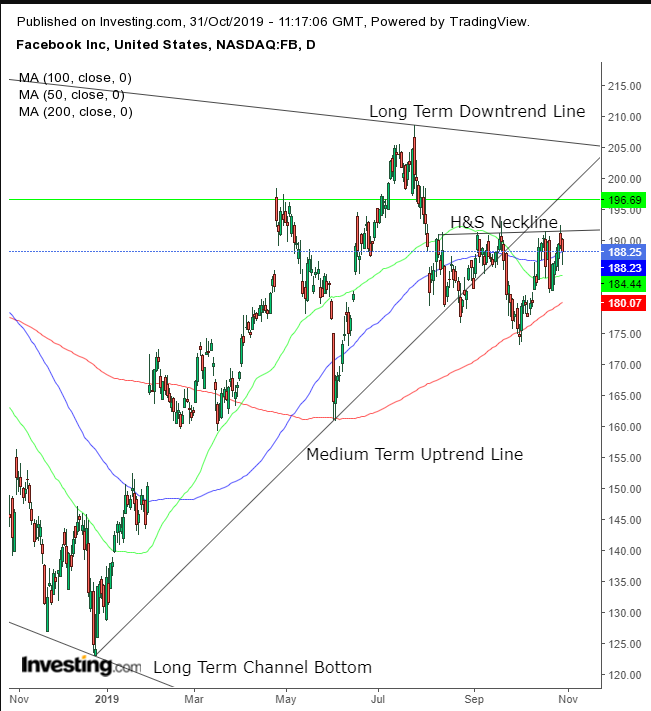
After yesterday's earnings beat, and with its shares up more than 4.0% in pre-market trading, we now expect Facebook (NASDAQ:FB) shares to extend their medium-term uptrend. However, the stock is likely to face opposition at the $205 level from long-term bears.
While the social media giant has become the subject of increased regulatory scrutiny and an ongoing public backlash, the company business continues to thrive. Based on yesterday's Q3 earnings report, Facebook reaches 2.45 billion monthly users. That’s a 1.65% increase from the 2.41 billion reported in the earlier quarter. As well, Facebook's daily active user count grew by 2%, to 1.62 billion from 1.587 billion during the previous quarter.
These are impressive numbers. That's especially true considering the company is likely nearing market saturation, given the number of people on the planet with access to a computer or smartphone is dwindling. Also, the social media behemoth posted $17.652 billion in revenue, a whopping 29% increase since the same quarter last year.
OK, their fundamentals are impressive. But that could easily change if Facebook is forced to: spin off Instagram; cave under pressure now that Twitter (NYSE:TWTR) is banning political advertising and succumb to an overall regulatory crackdown.
Nonetheless, in the medium-term investors remain bullish. Here's how to tell:

Facebook’s pre-market price is currently at $196.69 (green line). If the stock opens at this level, it will have completed a H&S bottom—whose significance is compounded by the 200 DMA—with a 2.5% penetration. Another 0.5% rise would complete the minimum conservative price filter, reducing the chances of a bull trap.
However, conservative traders should also consider a time filter, a minimum 3 days, during which the price remains above the pattern.
While the stock is in a medium-term uptrend, it's in a long-term downtrend—the result of all the negative PR and regulatory problems the company has been facing. Since March 2018 the stock completed a series of falling peaks and troughs. In September, the price fell below its medium uptrend since the December bottom, as the head of the pattern formed. The supply-demand balance will soon have to contend with the stock's colliding trends at the $205 level.
The Fed and trade uncertainty are also two illusive themes that can severely impact the outlook of the stock. If the Fed is seen to continue easing and/or phase 1 of the U.S.-Sino trade deal is signed, the medium-term uptrend is likely to break through the long-term downtrend. However, without continued Fed 'sweetener' and another trade turnaround, beware of pressure above $200.
Trading Strategies
Conservative traders should probably wait till a long-term resolution of the trend occurs, by either breaking the long-term falling channel or by falling below the $173.09, Oct. 2 low, making up the head of the H&S.
Moderate traders might go long after a return move that retests the $192 neckline support.
Aggressive traders should also wait for a return move—for an entry closer to the support—considering the potential supply above it, according to the declining, long-term trend.
Trade Sample
Author's Note: this is just a sample. It will not necessarily win, but it does demonstrate key trading elements.
Which stock should you buy in your very next trade?
With valuations skyrocketing in 2024, many investors are uneasy putting more money into stocks. Unsure where to invest next? Get access to our proven portfolios and discover high-potential opportunities.
In 2024 alone, ProPicks AI identified 2 stocks that surged over 150%, 4 additional stocks that leaped over 30%, and 3 more that climbed over 25%. That's an impressive track record.
With portfolios tailored for Dow stocks, S&P stocks, Tech stocks, and Mid Cap stocks, you can explore various wealth-building strategies.
