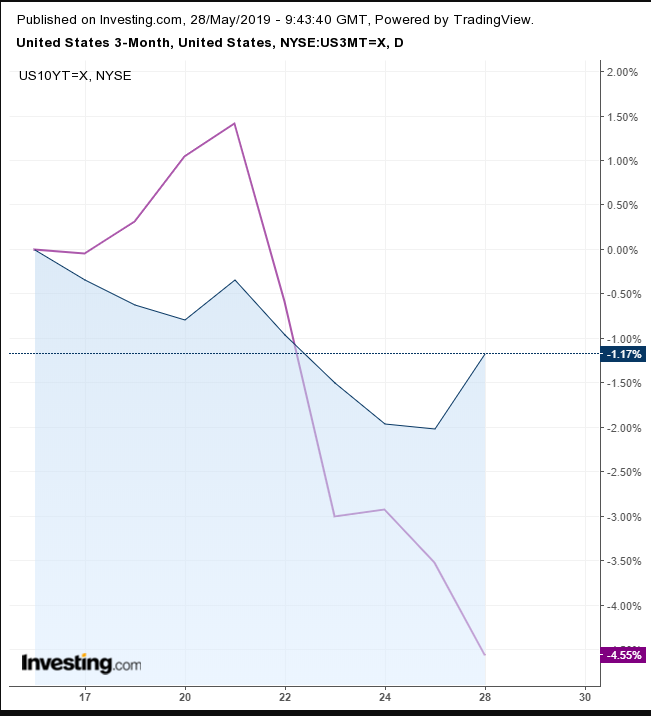
Treasury yields are falling. They've dropped below 2.3 overnight, to the lowest since 2017, as investor demand for safety surges.
The current yield is the lowest since mid-October 2017, suggesting traders—anticipating a series of upcoming Treasury auctions—are expecting yields to head lower still. Investors are also keeping a cautious eye out for a deluge of upcoming economic data including Pending Home Sales this week, Manufacturing and Non-Manufacturing PMI numbers as well as Unemployment and Nonfarm Payrolls releases next week. This run on Treasurys could point toward negative expectations for those as as well.

Additionally, at 2.285, 10-year yields are once again below the yield for the 3-month note, currently at 2.373. This type of yield inversion is often seen as an ominous sign of an oncoming recession.
Economist Gary Shilling—with a record of predicting recessions—said in February there’s a two-thirds chance of a recession. In March, the noted economist said that recessions signals are piling up, and in April he said a recession is definitely coming.
While economists may debate those predictions, we’re looking for trading opportunities. Yields last week registered a new low in the medium-downtrend, extending the projection for further declines.
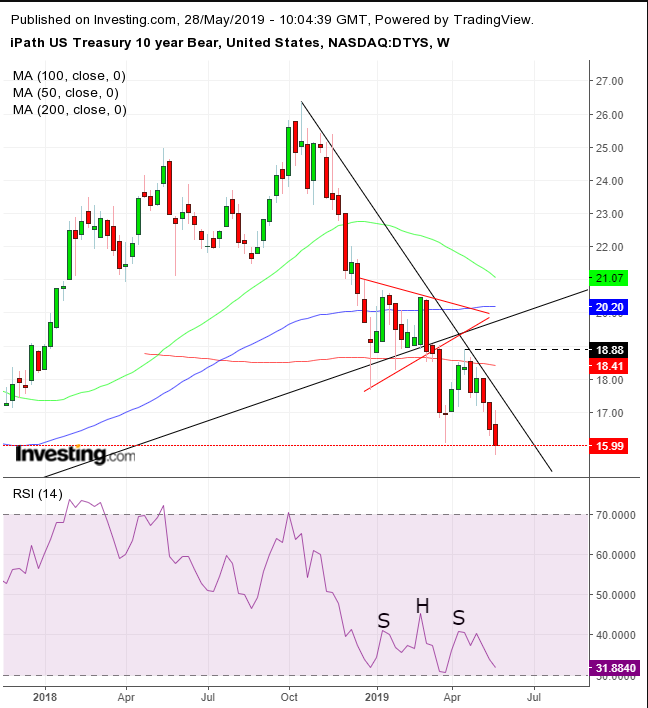
Investors can trade yields via iPath's U.S. Treasury 10-Year Bear ETF (NASDAQ:DTYS), which provides inverse exposure to the Barclays 10-Year U.S. Treasury Futures Targeted Exposure Index (NASDAQ:DTYL).

As we can see in the chart, the ETF fell to a new low within the downtrend, after testing the 200 DMA which pushed it further down. Before that, the ETF fell below its uptrend line in July 2016, as it completed a symmetrical triangle. This is bearish in a downtrend, especially after the downside breakout demonstrated that supply was overcoming demand, set to resume the prior downtrend.
The RSI is developing a potential continuation H&S
Trading Strategies
Conservative traders would wait for a second return move toward 18.88, the peak of the first return move. Then they’d wait for evidence of resistance, with at least one long red candle following a green or small candle of either color.
Moderate traders may be content with a return to the downtrend line since mid-October 2018, at about 17.00.
Aggressive traders might short now, providing they are operating according to a carefully laid out trading plan that fits their account.
Trade Sample
- Entry: 17.00
- Stop-Loss: 17.25
- Risk: 0.25
- Target: 16.00, above Thursday’s low’s support
- Reward: 1.00
- Risk-Reward Ratio: 1:4
