Breaking News
Get 45% Off 0
Is it finally time to sell Nvidia ahead of earnings?
Read More

Chart Of The Day: Trading Gold Amid Conflicting Intermarket Dynamics

By Investing.com (Pinchas Cohen)CommoditiesSep 24, 2019 09:43
ca.investing.com/analysis/chart-of-the-day-trading-gold-amid-conflicting-intermarket-dynamics-200431101
Chart Of The Day: Trading Gold Amid Conflicting Intermarket Dynamics
By Investing.com (Pinchas Cohen)   |  Sep 24, 2019 09:43
Saved. See Saved Items.
This article has already been saved in your Saved Items
 
 
XAU/USD
-0.04%
Add to/Remove from a Portfolio
Add to Watchlist
Add Position

Position added successfully to:

Please name your holdings portfolio
 
DX
+0.19%
Add to/Remove from a Portfolio
Add to Watchlist
Add Position

Position added successfully to:

Please name your holdings portfolio
 
Gold
+0.27%
Add to/Remove from a Portfolio
Add to Watchlist
Add Position

Position added successfully to:

Please name your holdings portfolio
 

Despite gold rallying for a fourth day, it’s being squeezed between conflicting market fundamental themes, including a global economic slowdown, dollar strength and the Fed's current interest rate policy. Understanding the various drivers and parameters can help gauge the next big move.

From its August 2018 bottom at the $1,160 level, gold has been driven higher because of its safe haven status. Since May it's received an additional bounce on the outlook for lower U.S. interest rates, whose outlook for a lower dollar-yield boosted the relative value of the non-yielding commodity.

Yesterday’s advance followed the Fed’s Bullard saying the central bank may need to ease monetary policy further, to offset downside risks from trade conflicts and too-low inflation.

But gold has been climbing since Thursday, ahead of Bullard’s dovish rhetoric. Beforehand, the yellow metal was trading within a holding pattern, in effect since mid-August, as investors awaited clarity regarding the Fed’s path to interest rates since the recent division of opinion among policy makers reduced the chances of additional cuts, even while Fed Chair Jerome Powell continues to reiterate that the Fed is monitoring the situation while remaining ready to continue easing as needed.

The commodity's advance is particularly impressive considering it's pushing ahead despite the weight of a third straight day of U.S. dollar strengthening.

But, why would the greenback move higher, if the yellow metal’s rally is a result of expectations for lower rates? That should hurt the dollar.

Perhaps the USD demand is coming from overseas, where a recession is all but a forgone conclusion and near-zero or even negative rates make Treasury yields look like a bonanza.

Given the conflicting intermarket dynamic, where is gold likely to go from here?
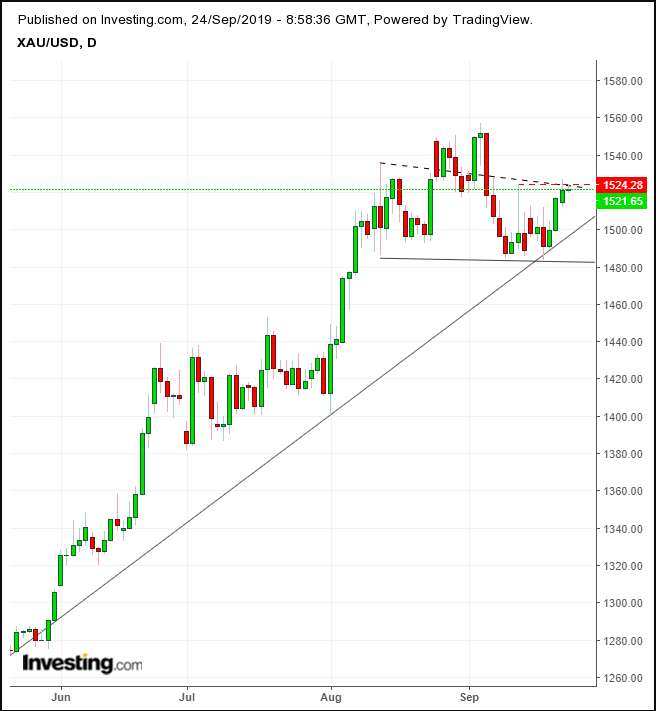
Gold Daily
Gold Daily

Gold’s current rally has brought the commodity to its highest in nearly three weeks, while slowing it at the same time. The balance of supply and demand reveal an unresolved collective investor mindset. The commodity is still within an uptrend since the May bottom, but the aforementioned holding pattern formed a H&S reversal, whose downside breakout would signal a downtrend.

However, the rally is shifting the price from the $1,480 neckline, the “line in the sand” for the trend. Still, the price slowed down by the Sept. 12 highs, as well as by the (dotted) trend line since the Aug. 13 high of the left shoulder.

In other words, this rally may simply play along the pattern’s dynamics, as it creates the right shoulder for a pattern that will end the uptrend.

So how to proceed?

Trading Strategies

Conservative traders would wait for either a downside breakout of the neckline or for a new high for a continued uptrend, using a three-percent filter to avoid whipsaws and see proof of trend with respective consolidations past the breaking points mentioned.

Moderate traders may wait for the same breaking points as conservative traders, though while they may wait for the return move for better entries, they won’t necessarily wait for support or resistance to strengthen the outlook.

Aggressive traders may enter a contrarian short position, taking advantage of the proximity to the resistance provided by the Sept. 12 high and that of the right shoulder.

Trade Sample – Short Position Setup

  • Entry: $1,522
  • Stop-Loss: $1,527 – above Sept. 12 high
  • Risk: $5
  • Target: $1,507 – uptrend line and congestion’s support
  • Reward: $15
  • Risk:Reward Ratio: 1:3

Chart Of The Day: Trading Gold Amid Conflicting Intermarket Dynamics
 

Related Articles

Frank Holmes
Gold: Is It Time for the US to Revalue Its Reserves? By Frank Holmes - Feb 24, 2025

Gold prices surged to an all-time high of $2,940 per ounce last Thursday, pushing its market cap above $20 trillion for the first time ever, as trade tensions between the U.S. and...

Chart Of The Day: Trading Gold Amid Conflicting Intermarket Dynamics

Add a Comment

Comment Guidelines

We encourage you to use comments to engage with users, share your perspective and ask questions of authors and each other. However, in order to maintain the high level of discourse we’ve all come to value and expect, please keep the following criteria in mind: 

  • Enrich the conversation
  • Stay focused and on track. Only post material that’s relevant to the topic being discussed.
  • Be respectful. Even negative opinions can be framed positively and diplomatically.
  •  Use standard writing style. Include punctuation and upper and lower cases.
  • NOTE: Spam and/or promotional messages and links within a comment will be removed
  • Avoid profanity, slander or personal attacks directed at an author or another user.
  • Don’t Monopolize the Conversation. We appreciate passion and conviction, but we also believe strongly in giving everyone a chance to air their thoughts. Therefore, in addition to civil interaction, we expect commenters to offer their opinions succinctly and thoughtfully, but not so repeatedly that others are annoyed or offended. If we receive complaints about individuals who take over a thread or forum, we reserve the right to ban them from the site, without recourse.
  • Only English comments will be allowed.

Perpetrators of spam or abuse will be deleted from the site and prohibited from future registration at Investing.com’s discretion.

Write your thoughts here
 
Are you sure you want to delete this chart?
 
Post
Post also to:
 
Replace the attached chart with a new chart ?
1000
Your ability to comment is currently suspended due to negative user reports. Your status will be reviewed by our moderators.
Please wait a minute before you try to comment again.
Thanks for your comment. Please note that all comments are pending until approved by our moderators. It may therefore take some time before it appears on our website.
 
Are you sure you want to delete this chart?
 
Post
 
Replace the attached chart with a new chart ?
1000
Your ability to comment is currently suspended due to negative user reports. Your status will be reviewed by our moderators.
Please wait a minute before you try to comment again.
Add Chart to Comment
Confirm Block

Are you sure you want to block %USER_NAME%?

By doing so, you and %USER_NAME% will not be able to see any of each other's Investing.com's posts.

%USER_NAME% was successfully added to your Block List

Since you’ve just unblocked this person, you must wait 48 hours before renewing the block.

Report this comment

I feel that this comment is:

Comment flagged

Thank You!

Your report has been sent to our moderators for review
Continue with Apple
Continue with Google
or
Sign up with Email