Despite today’s hefty jump in the price of oil—at time of writing the commodity has once again pushed past the $70 mark and is up 1.34%—momentum suggests bulls still have a long slog ahead.
WTI crude leaped on a trio of fundamental drivers: tropical storm Gordon, which hit Florida yesterday, is expected to gain strength and become a full-fledged hurricane by the time it reaches the U.S. Gulf Coast later today, where many US refineries and drilling operations are located; two oil platforms in the Gulf have already been evacuated ahead of the storm; and though sanctions won't officially go into effect until early November, the US has already been successful at stopping the sale of Iranian oil thanks to shipping data showing shrinking bookings for transport of the commodity months before actual delivery.
For these reasons, among others, energy expert John Kilduff, founding partner of Again Capital, sees the price of oil rising 30 percent to hit the mid $90s within months. Technicals, however, could be providing an opposing view for crude.

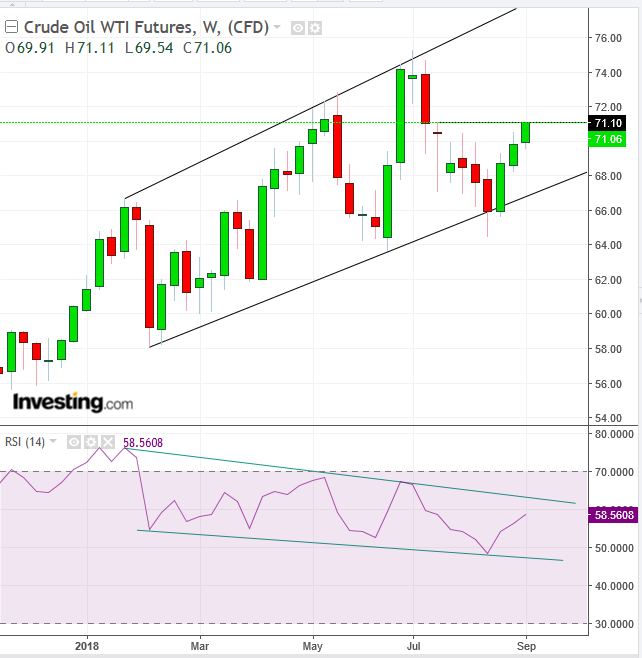
A simple technical chart shows that investors have been trading WTI within an ascending price channel. The pattern demonstrates an agreement among buyers and sellers that oil is underpriced. Therefore, not only are sellers willing to sell at ever increasing prices, buyers are also willing to buy at ever rising prices.
A deeper drilldown, however, reveals troublesome inconsistencies within this oil market dynamic. The RSI indicates that momentum has been waning throughout the exact period during which the rising price channel has been in place.
In fact, RSI is plotting a descending channel of momentum. This negative divergence suggests that while buying may have been overwhelming selling, it occurred on increasing weakness.
RSI is considered a leading indicator, as momentum generally precedes price. Note that the price, which has been rising for a third straight week, has stopped dead at the $71 level, a price that has proven a resistance since mid July. The next move may seal the fate of the black gold for the coming days and weeks.
Should the price successfully cross above the $71 level and form a new base at that height, it would demonstrate a flip in market psychology. Also, in the same time the RSI will break though the top of its descending channel, demonstrating that momentum would support the price.
On the other hand, should selling pressure overwhelm buyers, they may chase buyers down toward the channel bottom and the $64-5 levels. A break below that would suggest a continued selloff, as stop-losses and trade orders would be triggered, and speculators join what they’d perceive as the new direction.
Trade Strategies – Long Position Setup
Conservative Traders would wait for a new peak to be formed following the July, $75.27 high price, to extend the uptrend.
Moderate traders may wait for a close above $72. They may also wait for an additional day or two, to confirm that prices don’t fall back. They might also want to see the RSI pierce the top of its channel.
Aggressive traders may risk a long position, with a close above the $71.10 mid-July high price, provided it is also the top of the session. Even if prices haven’t gone higher, a close at the session height demonstrates a lack of selling resistance, relative to buying right now.
Trade Samples
- Entry: $72.00
- Stop-loss: 71.00
- Risk: $1.00
- Target: 75.00, below the July peak
- Reward: $3.00
- Risk-Reward Ratio: 1:3
Aggressive Trade:
- Entry: $71.15
- Stop-loss: 70.85
- Risk: $0.30
- Target: $72.35
- Reward: $1.20
- Risk-Reward Ratio: 1:4
