- All Instrument Types
- Indices
- Equities
- ETFs
- Funds
- Commodities
- Currencies
- Crypto
- Bonds
- Certificates
Please try another search

Chart Of The Day: Trading Oil's Potential H&S Bottom Reversal

A trifecta of fundamental events is currently driving the price of oil higher:
- Category 4 Hurricane Florence, which, as of this writing, appears set to make landfall on the US's southeast coast sometime Friday;
- Declining US oil inventories, at least according to yesterday's API weekly report;
- And looming sanctions against Iran which are scheduled to begin in early November.
As a result, WTI crude catapulted higher on Tuesday by about 3.4 percent, the most for the commodity since its 3.5 percent gain on June 26. Has oil finally bottomed?

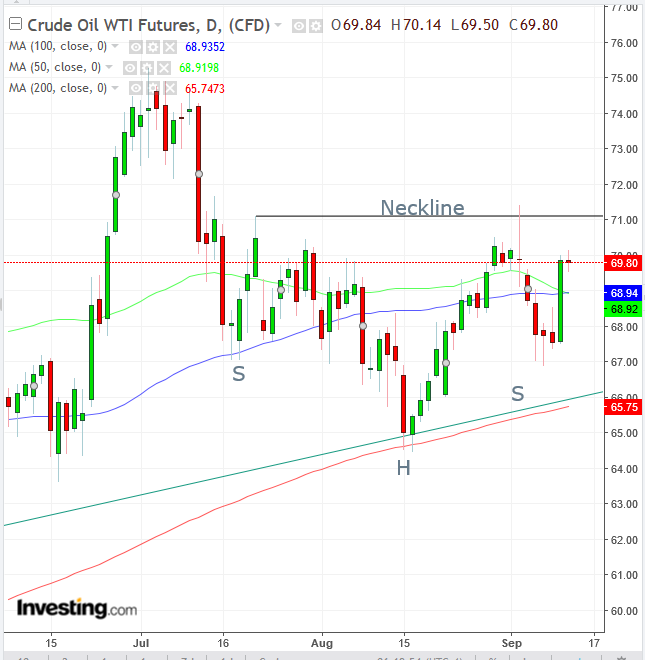
Yesterday's jump formed a potential right shoulder in an H&S bottom reversal. Note that the head reaffirmed the uptrend line since mid-November, which was "guarded" by the 200 DMA, demonstrating its technical importance.
The jump brought the price back above the 50 and 100 DMA. However, those benchmarks aren't significant in this market dynamic, as prices have been trading sideways since July, trampling all over these MAs.
The most accurate 'tell' that another move higher is on the way would be penetration of the $71 level, which would complete the bottom pattern. This would signify that prices may be on the way to overcoming the $75 July peak.
Trading Strategies – Long Position Setup
Conservative traders should wait for a higher peak, to extend the uptrend above $75.
Moderate traders may rely on a 2 percent penetration of the $71 level, to avoid a bull trap. Another filter would be to wait for a closing basis.
Aggressive traders might be content with a 1 percent filter basis, preferably on a closing basis.
Trade Sample
- Entry: $72.00
- Stop-loss: $71
- Risk: $1.00
- Target: $75
- Reward: $3
- Risk-Reward Ratio: 1:3
Related Articles

Oil prices are largely under pressure amid demand concerns, while the European gas market continues to sell off aggressively Energy – TTF Sell-Off Continues Oil prices continued...

Gold prices surged to an all-time high of $2,940 per ounce last Thursday, pushing its market cap above $20 trillion for the first time ever, as trade tensions between the U.S. and...

Gold remains at technically overbought levels across multiple time frames, with RSI showing negative divergence, signaling potential weakness. Gold’s strong correlation with the...
Are you sure you want to block %USER_NAME%?
By doing so, you and %USER_NAME% will not be able to see any of each other's Investing.com's posts.
%USER_NAME% was successfully added to your Block List
Since you’ve just unblocked this person, you must wait 48 hours before renewing the block.
I feel that this comment is:
Thank You!
Your report has been sent to our moderators for review


Add a Comment
We encourage you to use comments to engage with users, share your perspective and ask questions of authors and each other. However, in order to maintain the high level of discourse we’ve all come to value and expect, please keep the following criteria in mind:
Perpetrators of spam or abuse will be deleted from the site and prohibited from future registration at Investing.com’s discretion.