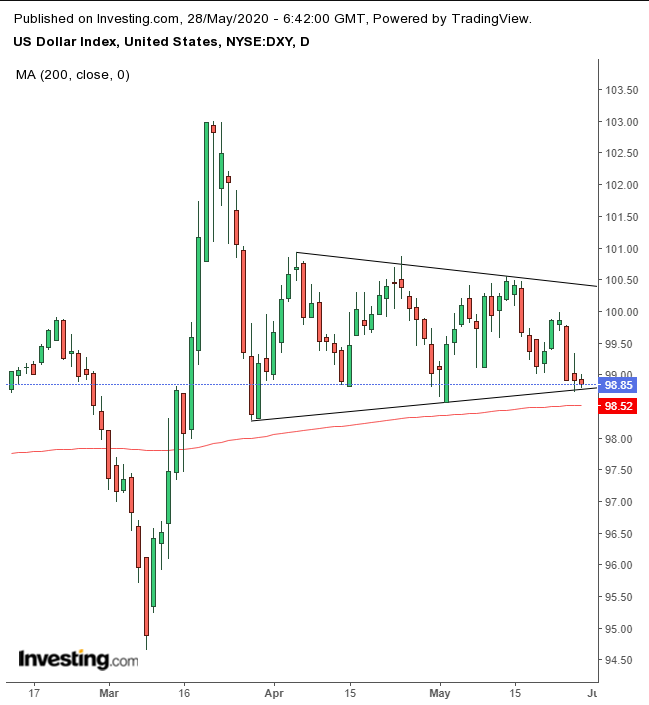
The US dollar eased this morning, after yesterday whipsawing wildly between 0.3% gains and losses but closing only 0.1% lower. A key conflict FX traders are facing with regard to the USD: they must sort through the impact of falling interest rates versus the greenback's status as the global reserve currency, a safe haven and the base currency for Treasurys—the safest asset on the planet, therefore often in great demand.
Those are some pretty significant fundamental drivers, which help explain why traders can't seem to decide which way the greenback should head next. Adding to that indecision are short- and longer-term economic concerns, ahead of today's Initial Jobless Claims data. After today's release, it's expected that more than 40 million Americans will be unemployed as the months-long coronavirus devastation continues to impact global economies.
Goldman Sachs predicts that high rates of unemployment will persist for two years, slowing the economic recovery. Forbes has reported that “millions of US jobs are never coming back.” It's no wonder then, that the next direction for the USD is difficult to determine.
And much like our analysis yesterday of gold, the dollar is another asset that's likely to undergo a strong move once traders finally recognize a trading pattern they can follow
The recent trade pattern formed a High-Wave candle. The name is a visual description that aptly depicts wild ocean waves moving up and down.
This stormy image is the outcome of conflict that often warns of a critical technical pressure point that may lead to a reversal. The presumed dynamics are those of a market without leadership. It expresses deep uncertainty in which traders run one way, then the other on rumors and innuendo—in short, speculation without certainty.
Yesterday the USD tested the bottom of a range in place since the March 27 low. The converging pattern demonstrates that overall both supply and demand have been adding positions. However, after the dollar fell yesterday to the bottom of the pattern, traders weren’t sure what to do. Today’s calm suggests a wait-and-see approach as traders hang back until something new develops.
When a price forms a symmetrical pattern, as is the case here, the odds are higher that the breakout will be in the direction of the overall trend. However, the Dollar Index has been moving sideways since October 2019, swinging wildly above and below the emerging pattern.
Therefore, we can’t be confident that the price will necessarily rise from this point, leading to an upside breakout of the range. The 200 DMA trailing the bottom suggests chart followers may support the price. But then again, it would only serve as a catalyst for a selloff if it fails to prop up the USD.
Having said all that, the dollar does afford a favorable risk-reward ratio, since it's at the very bottom of the congestion. That may be enough to take a risk on this trade—provided traders follow a plan that suits their account and trading style.
Trading Strategies
Conservative traders would wait for the breakout and trade that direction.
Moderate traders are likely to enter a long position with a close higher than yesterday’s.
Aggressive traders may go long now, after formulating a trade plan they could stick to.
Trade Sample
Entry: 98.80
Stop-Loss: 98.40 – below the 200 DMA
Risk: 40 pips
Target: 100 – May 25 high and psychological, round number
Reward: 120 pips
Risk:Reward Ratio: 1:3
