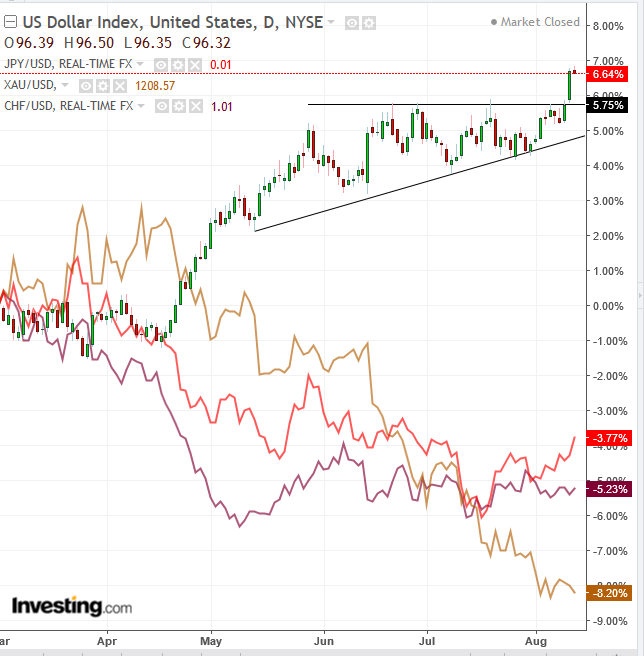
The US dollar keeps gaining ground amid mounting geopolitical uncertainty, as investors increasingly look at the greenback as a trade for all seasons.
Since trade worries first took hold of the global market narrative in March, traders have rushed into the U.S. dollar both as a safe haven and a growth asset, while shedding the yen, the Swiss franc and gold.
When the U.S., in 2008, exported the largest financial crash since 1929 to the rest of the world, global investors somewhat counter-intuitively rotated their capital into U.S. assets, prompting a sharp rally in the buck. In that instance, as well, the yen, the franc and bullion all tumbled, signaling that investors had more faith in the economic, political and military stability of the U.S. than in any other country of the world. That seems to be the case now, too.
While the economies of China and Europe showed signs of a slowdown, justifying a cautious approach to interest-rate hikes, U.S. figures have consistently posted a stable pace of growth, allowing the Fed to stick with its tightening plans. This widening interest rate differential is favoring the U.S. dollar. So, how much higher will geopolitical headwinds prop the USD?

The dollar has provided an upside breakout to an ascending triangle, a pattern that develops when demand absorbs all the available supply within its boundary and bids prices higher to find more willing sellers.
Trading Strategies
Conservative traders would wait for a 3% filter of the upside breakout to avoid a bull trap. So far, the penetration satisfied only a 1% aggressive filter. They might then wait for a return move to verify the pattern support -- showing that demand still outpaces supply at these levels -- with at least one long, green candle engulfing the preceding red or small candle of any size.
Trade Sample
- Entry: 95.50, after penetrating the 3% filter to 98.36.
- Stop-loss: 95.00, psychological round number
- Risk: 50 pips
- Target: 98.80, based on the height of the pattern
- Reward: 380 pips
- Risk-Reward Ratio: 1:7
Moderate traders are likely to be satisfied with a 2% filter. They may wait for a return move for a better entry, but not necessarily for proof of pattern integrity.
Trade Sample
- Entry: 95.50, after penetrating the 2% filter to 97.4
- Stop-loss: 95.00, psychological round number
- Risk: 50 pips
- Target: 98.80, based on pattern height
- Reward: 380 pips
- Risk-Reward Ratio: 1:7
Aggressive traders may enter a long position immediately as the aggressive, 1% penetration has already been achieved, providing they could afford a stop-loss beneath the triangle top to accommodate a whipsaw or accept the risk potential into their portfolio management.
Trade Sample
- Entry: 95.50, after satisfying a 1% penetration to 96.45
- Stop-loss: 95.00, psychological round number
- Risk: 50 pips
- Target: 98.80, based on pattern height
- Reward: 380 pips
- Risk-Reward Ratio: 1:7
Note, all targets and stop-losses and naturally risk-reward ratios are identical. The only difference between the risk levels is confirmations.
