Bitcoin soared above $9000 on one small Singapore-based exchange on Wednesday, while its global average price hovered around $6,402.8. It isn't clear why the digital token was trading 50 percent higher on the World Exchange Services, or WEX exchange, versus other global platforms.
However, the trading anomaly re-ignited credibility issues around the cryptocurrency, which has recently been plagued by suspicions of trade fixing. The price of Bitcoin slipped 3.8 percent lower by the mid-European session on Thursday, at time of writing, to around $6,159.
Crypto experts are disagreeing over where Bitcoin will move next. One anonymous Austrian bull bet $8.5 million prices will reach $280,000 in five years. Representing the opposite camp, cyber security expert Joseph Carson at Tychotic, an enterprise protection agency, believes BTC could fall as low as $43, as mining costs increase.
Who’s right?

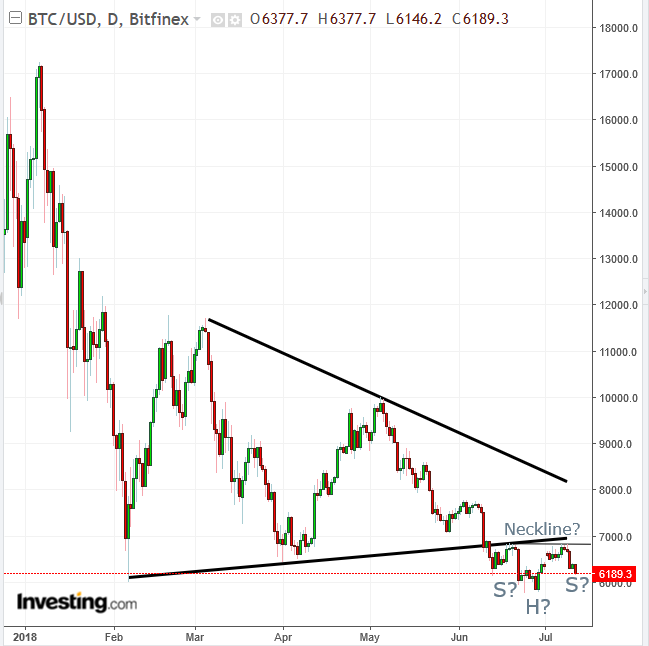
Both views are finding some confirmation in the symmetrical triangle-shaped consolidation between February and June. Bears are pressuring prices lower, toward the pattern's bottom, while bulls are picking up the supply, pushing prices back toward the range's top. Both sides are confident they are going to make money.
However, the June 12 downside breakout demonstrates that sellers have been outpacing buyers, which can also be seen in the triangle’s steeper top. Supply has engulfed demand within the pattern, forcing sellers to agree to sell at prices lower than the range in order to find willing buyers. Since then, there have been two return moves—in late June and early July—as prices retested the pattern’s resistance.
Still, should the current decline fail to register a lower trough and break above the dual return-move highs, it would complete a small H&S bottom, which could propel prices at least to the triangle top, currently at about $8,000.
Meanwhile, the downside breakout not only demonstrates that momentum is on the side of supply but also triggers stop-losses from technically oriented buyers, removing their demand from the equation, while prompting sell-orders. Presumably, this dynamic will intensify, as buying dwindles and selling increases.
Trading Strategies – Short Position Setup
Conservative traders would wait for confirmation of the downtrend, when the price posts a new low, below $5,762.0 registered on June 24.
Moderate traders may wait for a pullback, in order to enter close to the $6,800 return-moves' highs, to avoid a whipsaw.
Aggressive traders might short now.
Equity Management
Trading without a plan is gambling. Don't enter a trade before understanding potential risk and reward. As well, ensure that your plan fits your overall equity management. The minimum risk-reward ratio should be of 1:3, to get on the right side of statistics.
Trade Examples:
Conservative
- Entry: $5,759, upon a close below the June low and below the psychological round number
- Stop-loss: $5,763, above the June low, now a presumed resistance
- Risk: $4
- Target: $5,501, above the psychological round number, a presumed support
- Reward: $258
- Risk-Reward Ratio: 1:64
Moderate
- Entry: $6,799, below return-move highs
- Stop-loss: $6,999, below the psychological round number and triangle bottom
- Risk: $200
- Target: $6,001, Above psychological round number support
- Reward: $798
- Risk-Reward Ratio: 1:4
Aggressive
- Entry: $6,182
- Stop-loss: $6,403, above yesterday’s high
- Risk: $221
- Target: $5,519
- Reward: $663
- Risk-Reward Ratio: 1:3
