by Pinchas Cohen
Yesterday we published a bearish analysis on the dollar, on the heels of the currency's anticlimactic response to the Senate passing tax legislation. The post elaborated on the argument that when good news fails to motivate investors, it bodes poorly for the asset. It suggests that either the good news is already priced in—in which case any bad news will surely push it down—or that there are other negative, unknown considerations. Our analysis suggested the greenback is likely to fall further.
Gold's Negative USD Correlation
Today's post is a mirror-image analysis for gold. There are two reasons gold has a negative correlation with the dollar.
First, it's priced in dollars. Therefore, a stronger USD makes gold more expensive and thus less attractive to buyers; a weaker dollar makes gold cheaper, providing a buying opportunity.
Second, the dollar is considered a risk asset (although, ironically, during global turmoil, such as the 2008 crash, it is considered a haven currency, as people have faith in its political stability and military might), while gold is the original safe haven asset.

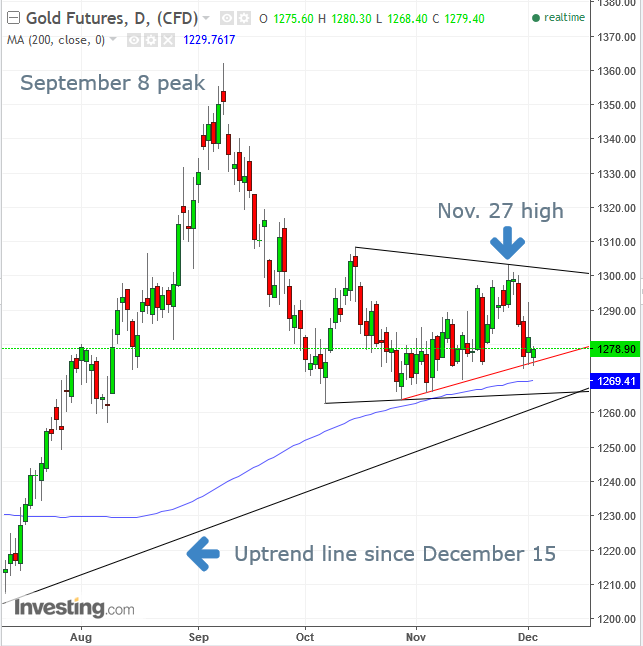
While gold failed to resume its current uptrend since December 15 by not registering a higher peak than its former, September 8 high at $1,362.40, it is still within the uptrend.
USD's Resistance, Gold's Support
In mirror-image to the various technical events that provide resistance to the dollar (or an expectation for supply to overcome demand), gold has very similar, reverse technical developments that provide support (or an expectation for demand to overcome supply).
The dollar had three resistances:
- Its downtrend line since November 7
- Trading range top
- 100 dma
Gold has three supports:
- Its uptrend line since December 15
- Trading range bottom
- 200 dma
An Alternate View For Gold
An alternate view for gold may be how best to view the shape of the trading range. An argument can be made that this isn’t what Charles H. Dow, the father of modern technical analysis, termed a “line,” as in a flat range with two parallel lines in the shape of a rectangle. Since the price increased the angle of acceleration (red line), a technical analyst may decide to exclude the previous low of October 6 and only connect the lows since October 27 (red line).
The difference is that excluding the October 6 trough turns the range into a symmetrical triangle. That shape demonstrates two opposing forces inching toward each other until they meet in the flesh, toward the apex. This leads to a violent struggle which culminates in the victor pushing the opposing force beyond his line.
When that happens, vanquished traders realize they were wrong and join the victors. Symmetrical triangles are generally continuation patterns. Since this triangle (should it prove to be one) followed the 7.25 percent fall from September 8, a continuation would suggest an extension to that fall.
However, since the price action is still trading above the uptrend line, we believe it is more likely to resume the uptrend. The 200 dma further supports that view.
Still, considering the myriad, complex nature of the market, especially during a potential breakthrough for tax reform (which would backfire if the Senate and House can’t compromise on their respective bills) as well as potential obstruction of justice charges against President Donald Trump, which some claim are impeachable offenses (which may boost stocks, if the investigation ends), the tide could shift. Therefore, one should only aim for the short to midterm, keeping a close watch on the key levels of support and resistance, which, if violated, may suggest a reversal.
Trading Strategies
Trading a Long Position
Conservative traders would wait on a long for a resolution of the trading range since October 16, with a decisive upside breakout above the $1,303.40, November 27 peak, a return move and confirmation of the pattern support, with an up-day closing higher than the preceding down-day.
Moderate traders should enter a position on an upside breakout of the range top, above $1,300, per the current angle.
Aggressive traders may enter a long now, taking advantage of the extremely favorable risk-reward ratio, on the closeness of the smaller range bottom (red line), or the low of the day at $1,273.90 and the distance of the range top, at $1,300, offering an almost 1:5 risk-reward ratio.
Patient traders, who can stomach wild fluctuations, would achieve compounded profits if they wait for an upside breakout target, which may retest the September 8, $1,362.40, providing almost a 1:19 risk-reward ratio.
