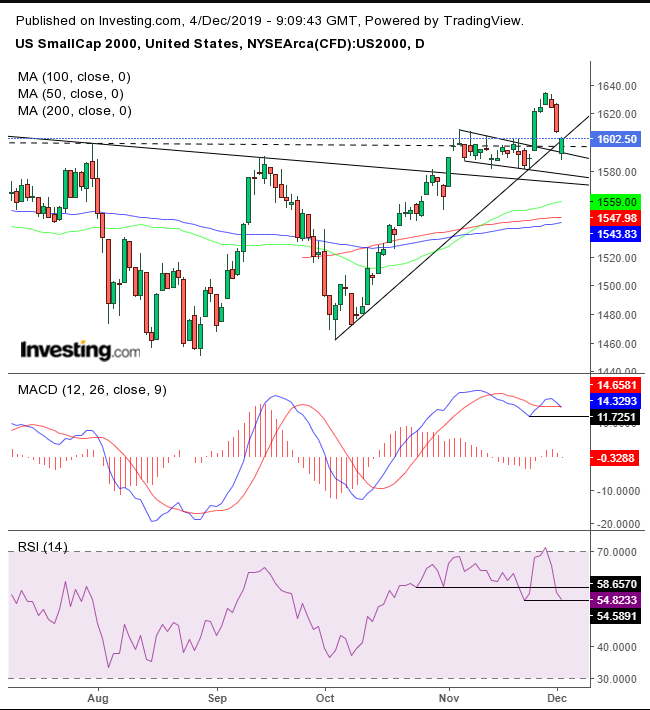
The Russell 2000 could be on the verge of another rally, as a market recalibration in favor of domestic shares is likely to build on their YTD underperformance.
Small cap companies are generally immune to the retaliatory duties that internationally-focused organizations may face if trade negotiations fail, making them more attractive as the uncertainty over potential tariffs grows.
Indeed, yesterday all four major U.S. indices sold off for the fourth day, with the dramatic lower opening exacerbating risk-off as it appeared hopes of an imminent agreement on Phase I of the long-awaited U.S.-China trade deal were quickly dwindling.
On Monday, U.S. President Donald Trump hit Argentina and Brazil with tariffs and started eyeing Europe for the same. This set the market tone for the overall trade theme, demonstrating that the U.S. has not reversed policy over its president's hawkish approach to what he considers an uneven trade platform.
However, there is a silver lining for investors. All four indices closed well off their lows, erasing most of the losses and ending the session at their opening prices. This buying dip demonstrates demand and even potential accumulation, when smart money buys into low prices, because it believes that prices will hold and even rise.
Last week, we made the case that small caps are best positioned for a rally, due to their longer-term undervalued position relative to large caps. Our chart analysis agreed with that fundamental assessment and suggested the current dip was merely playing out the bullish pattern and even reinforcing its support.

The decline dipped into the falling, bullish flag between Nov. 5 and Nov. 25 but ultimately closed right above it, establishing the presumed demand above the bullish pattern. The only concern is that the gauge slipped below the uptrend line from the Oct. 3 bottom. However, this is mitigated by the knowledge that flag formations often deviate from trend lines, as they represent temporary interruptions of the overall trend.
The 50 DMA crossed above a rising 200 DMA — forming an exceptionally dramatic golden cross — amid the falling channel development, demonstrating across-the-board bullishness, as separate technical triggers agree.
The MACD and the RSI demonstrate that the price is primed for a downward correction, vindicated by the current selloff, which pushed prices below the uptrend. However, both the RSI and the MACD remained above their previous lows, made when the index reached the bottom of the flag on Nov. 21.
This support by the MACD (which demonstrates that a broad range of prices have support) and the RSI (which demonstrates that momentum remains up) confirms and reinforces the outlook for another rally.
Trading Strategies
Conservative traders would wait for a high above the Nov. 27 level to prove the uptrend has survived.
Moderate traders are likely to want to see the price return above the uptrend line.
Aggressive traders may risk a long position now, providing they understand the risks.
Trade Sample
Note: A sample demonstrates the components of a trade plan. Trading success is measured by overall trading, not based on a single trade. Also, both the risk and the reward could be amended based on risk aversion.
