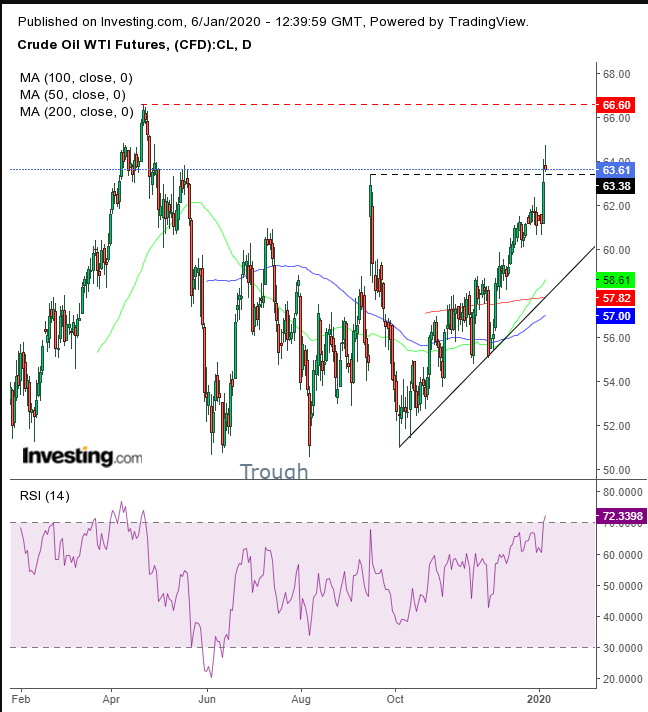
The U.S. announced Thursday night that it had killed influential Iranian general Qassem Soleimani — and WTI closed more than 3% higher.
Since then, news outlets and social networks were raging. ABC News characterized the situation as “U.S. and Iran on the brink of war.” Iran vowed retaliation and the U.S. selected 52 sites in the Middle Eastern country to bomb if it does. Now, General Esmail Ghanni, Soleimani's successor, has pledged revenge. Oil is up another 1.25% today.
However, the commodity is well off its highs, when it was up 2.65%. Why is this? If war breaks out between the U.S. and Iran, the Middle East oil supply will be disrupted.
From a fundamental perspective it appears to be a no-brainer. Perhaps the retreat from the day’s highs are on technicals.
The price fell from April’s $66 highs to June’s $50 lows on oversupply and a slowing global economic outlook, exacerbating an already deluged market. Recent developments on the road to a possible trade deal between the U.S. and China, as well as some promising economic data, improved that forecast and its concomitant expected demand for oil. And, as the chart illustrates, the price rose accordingly.

The price is 24.5% above its October bottom. That’s a big move in just three months. Some traders made a lot of money, quickly, and they might like to lock in profits, before a correction.
But why would there be a correction, if we’re on “the brink of war” that could lead to the oil supply being disrupted?
Because anything can happen, no one knows what will happen and investors who made a great deal of money don’t want to lose it.
After reaching the highest since April and as the price nears April’s peak, investors have started getting nervous about losing their winnings. And who could blame them?
Look how far the price spiked above its uptrend line since September, even before the recent escalation of events between the U.S. and Iran.
Note that the Sept. 16, $63.38, peak is proving to be a resistance, as the price is falling toward it. Some traders will well remember the near 20% dive it took afterwards in just six weeks.
Meanwhile, the price is developing a shooting star as well as an overbought RSI — the highest since mid-April, right before it took a 24% drop — which increases the chance of a pullback toward the uptrend line, currently just above the $60 mark.
As of now, the medium term is still sideways, until the April peak of $66.60 is bested.
Trading Strategies
Conservative traders would wait for the pullback and evidence of support above the uptrend line before entering a long position.
Moderate traders will look for a closing price to lock in the shooting star, wait for the next day to retest the highs and enter a short position at that point.
Aggressive traders may go short after closing, providing they understand the risks.
Trade Sample – Short Position Setup
