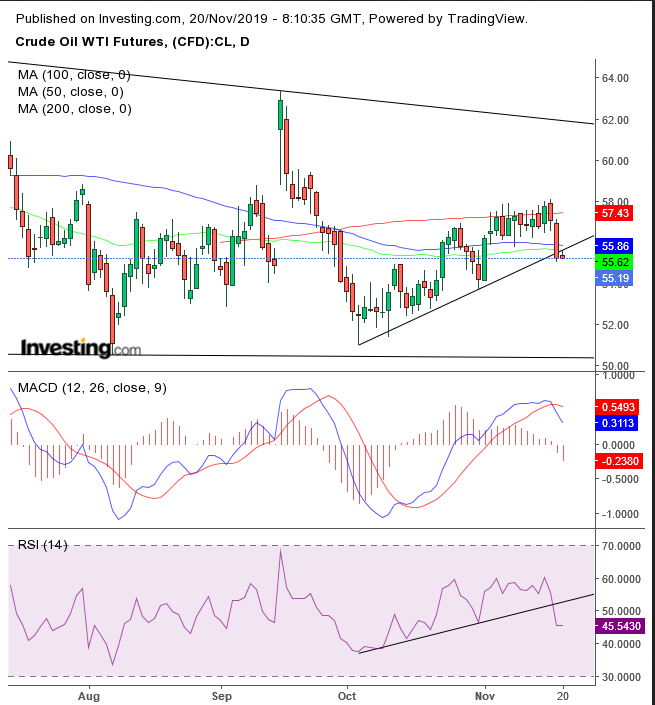
Rising U.S. crude inventories, a weakening Chinese economy and an ever-elusive trade deal are setting up oil prices for another fall.
WTI edged down, slipping from a rebound and extending a slide for the third day, for a total loss of 4.25%. The fundamentals are giving bulls a hard time and the technicals are augmenting the case that there's more downside ahead.
API reported yesterday that U.S. inventories rose by 6 millions barrels for the week ending Nov. 15. This latest data exacerbated concerns raised by a Reuters report that Russia will probably not support cutting output further in the next OPEC meeting, Dec. 5-6.
China’s slowing economy has depressed demand too. As a corollary, oil increased over 4% on positive Chinese data back in September.
Prices have also been extremely sensitive to the outlook on a trade deal between China and the U.S. A trade resolution now appears to be even further away after the U.S. Senate passed legislation backing Hong Kong protestors.
From a technical standpoint, the price of crude is showing signs of weakening, as well.

WTI slipped below an uptrend line since the Oct. 3 low, which included sliding below the 100 and 50 DMAs, breaking away below a congestion since Nov. 4, and showing evidence of supply above the 200 DMA.
Both the MACD and the RSI provided sell signals. The former’s short MA fell below the long MA, after reaching an overbought condition. The RSI fell below its own uptrend line, demonstrating that momentum was weakening along with the price.
Should prices remain below the short-term uptrend line, momentum will be to the downside, till the next main support, the $50 level.
The psychological round number has proven a line of demand since early June, keeping the lows flat. The highs, on the other hand, have been declining since late April to September. If the decline continues, the steepening, which has accelerated up until now, could intensify.
The described pattern makes up a descending triangle — one where supply has the upper hand in the balance of powers — a top from the perspective of the $42.36 low registered on Dec. 24, or a continuation pattern, if looking from the point of view of the Oct. 3, $76.90 high. Either way, the implication in both is that if the $50 support gives way, prices are likely to extend lower.
Trading Strategies
Conservative traders should wait for the resolution of the down sloping range since the April high.
Moderate traders may wait for a 2% penetration to $54 and a return move to retest the new, presumed resistance.
Aggressive traders may short after a 1% penetration to avoid a bear trap, then wait for a return move, for a better entry.
Trade Sample
