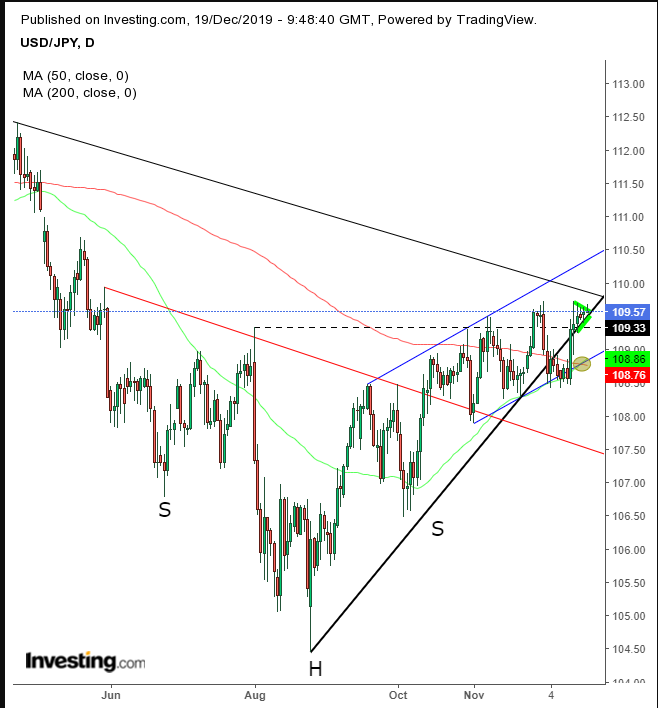
The dollar-yen pair is struggling to maintain an advance, the fifth day out of six. And going forward, the horizon becomes less clear for the yen; this is apparent both in the fundamentals, that are providing a mix of good and bad news, and in the technicals.
The good news first: Bank of Japan kept its policy in place, which is seen as relatively hawkish because it didn’t move to or signal it would boost stimulus even amid a highly uncertain global environment.
But then comes the bad news: the BOJ has painted a gloomier picture for factory output than it did in October, as the gauge fell for the twelfth straight month – the longest run of declines in exports since a 14-month stretch to November 2016. Demand from both the U.S. and China has been in decline. While that may change if the two economic superpowers of the world are able to agree to a final, all-encompassing trade deal, that prospect still seems very far away, with the two countries yet to even sign on Phase I.
However, there's also more good news: at the same time, the central bank raised its economic growth forecast for next year to 1.4% from its 1.2% prediction in July. The rise is based on an improvement in domestic demand due to stronger corporate investment and a boost to growth from public spending forming part of the fiscal package approved by the Cabinet this month. Government spending is expected to increase to 2.7%. Also, public demand is expected to add 0.5% to GDP next year, up from the previous forecast of 0.2%. This domestic demand is seen to offset waning external demand.
Taking into account the above conflicting economic data and its interpretation, we now turn to the supply-demand data and relevant interpretation. And indeed, we see the same opposing forces in the charts.

The USD/JPY has been fluctuating within a pennant formation (converging green lines), which is considered bullish after the 1.15% jump in just two days, Dec. 12 and 13. The continuation pattern’s bullishness is underscored by the fact that the price has climbed back above the uptrend line (thick line) since the Aug. 26 bottom and the golden cross amid the jump. Also, the price has been traded within a rising channel since November (parallel blue lines). Moreover, the rising channel picked up right on top of the neckline of an H&S bottom.
However — and this is a big one — the pennant formation, whose bottom is right on top of the uptrend line, has its top below the long-term downtrend line since Oct. 3, 2018.
Will all the bullish indicators overcome the long-term downtrend lines? We expect them to, but only time will tell.
Trading Strategies
Conservative traders will wait for a conflict resolution, after the price settles above 110.00.
Moderate traders may risk a long position upon the pennant’s upside breakout.
Aggressive traders may go long now, providing they write out their trading plan and understand the risks.
Trade Sample
