Don’t worry about oil prices going to the teens. They already have, between Friday’s settlement and Monday’s open, in that black hole called electronic trading.
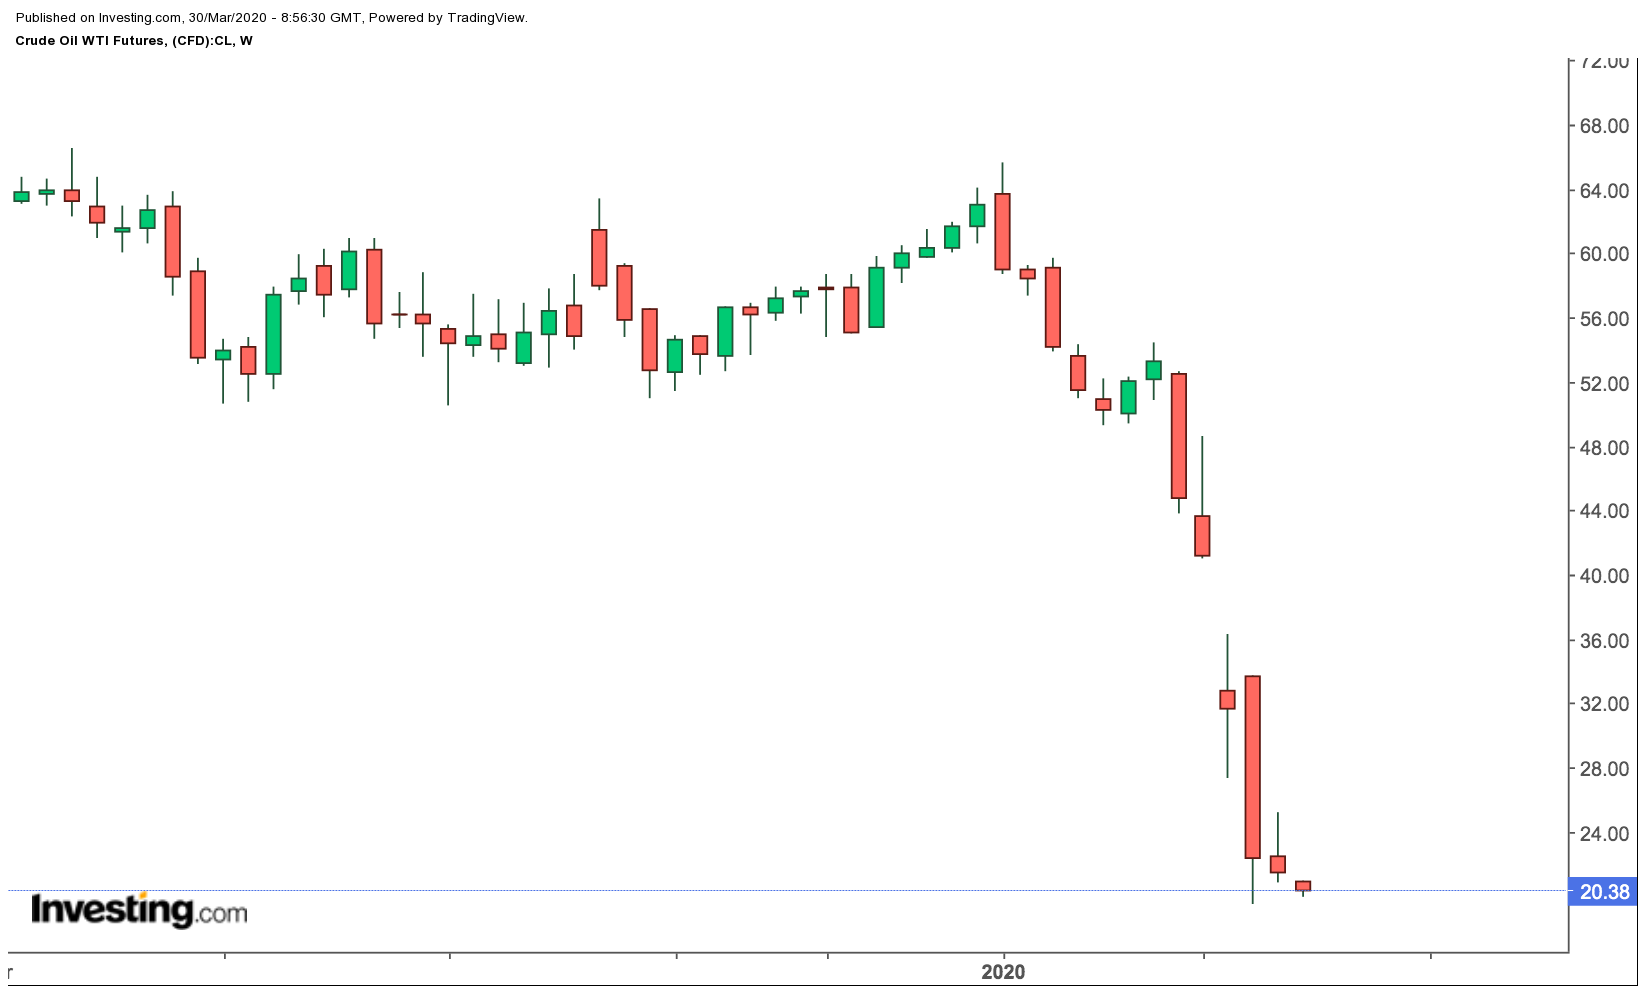
As I write this, U.S. West Texas Intermediate has gone back above $20 per barrel in Singapore’s noon trade after registering a low print of $19.92, a bottom since February 2002. It could, of course, return to sub-$20 levels in advance of or during the New York hours. 
But whatever happens in today’s session or through the week, WTI is unlikely to set a much lower milestone than that 18-year bottom. If it gets past the February 2002 trough of $19.09, the next lows are $17.85 from January 2002, $17.80 from December 2001 and $16.70 from November 2001.
However, the story is not about how much lower oil could go from here. It’s about whether anything can be done to stop the systemic annihilation of U.S. shale drillers, most of whom can barely survive at under $35 per barrel.
This isn’t a story whose conclusion will be seen this week. But it’s a story we need to keep our eyes on because it will be the biggest for oil once the havoc wreaked by the COVID-19 pandemic is settled.
Crash And Doom Awaits U.S. Shale
The bottom line is this: no matter the cuts in capital expenditure, exploration or outright production — or even intervention by the Trump administration — the U.S. crude industry is unlikely to be the same again, with about 30% or more of local drillers expected to end belly up.
Both the Saudis and Russians, who are on optimum-production mode to add to the demand destruction from the coronavirus crisis, intend, over the next six months, to grab as much of the global market share for oil that they don’t already own.
One way to achieve that will be to decimate U.S. drillers, who gained 4 million barrels per day in crude volumes over the past three years to become the No. 1 world producer at 13 million bpd, while Riyadh was diligently enforcing cuts to its production under the OPEC+ initiative and the Kremlin largely played hooky under the same pact.
The U.S. oil industry is now a critical component of the domestic economy, supporting 10.9 million jobs, according to the American Petroleum Institute. But shale isn’t built for low prices and faces bankruptcies and big job cuts from the one-two COVID-19-Saudi/Russian punch, as most forecasters anticipate a demand loss of at least 10% or 20 million barrels per day.
“The difference between today and 2015/16 is that shale and high-cost oil producers were already facing sharply elevated costs of capital over the past year due to persistently poor shareholder returns,” Goldman Sachs said in a note.
“Indeed, these capital restrictions have only been exacerbated by recent events, whereas in 2015/16 capital never dried up – making the likelihood of capitulation by U.S. E&Ps and EM producers much higher today,” the Wall Street bank added, referring to shale explorers and producers as well as emerging market producers.
Saudis Making A Horrible Situation Worse
Energy Intelligence, in a separate note, said Saudi Arabia’s move to flood the market after the early March collapse of OPEC+ has made a horrible situation worse. “So horrible, in fact, that the Trump administration is making diplomatic overtures to Saudi Arabia to end its price war with Russia and provide support to collapsed oil prices, which are devastating the U.S. shale industry.”
The New York-based energy consultancy adds: “After 40 years of OPEC bashing, Washington is considering the once unthinkable: coordinated action with Saudi Arabia, Russia and other producers — a reflection of the extraordinary times oil markets have entered.”
From trying to get Texas, the largest U.S. oil producing state, to enforce cuts on drillers in its patch, to playing peacemaker between the Saudis and Russians to convince both to slash output again and pursuing an exclusive U.S.-Saudi deal to manage the world crude market, Washington is firing on multiple cylinders at once.
“There are many, many ideas that have floated around the policy space,” U.S. Energy Secretary Dan Brouillette said, underscoring the administration’s zeal to save an industry that has made America a net oil exporter and partially energy-independent.
So far none of Washington’s tricks seems to be working. The Saudis are determined to grow their production by a whopping 30% in March to reach a record 12.3 million barrels per day by end-April.
All In Oil Are Hurting
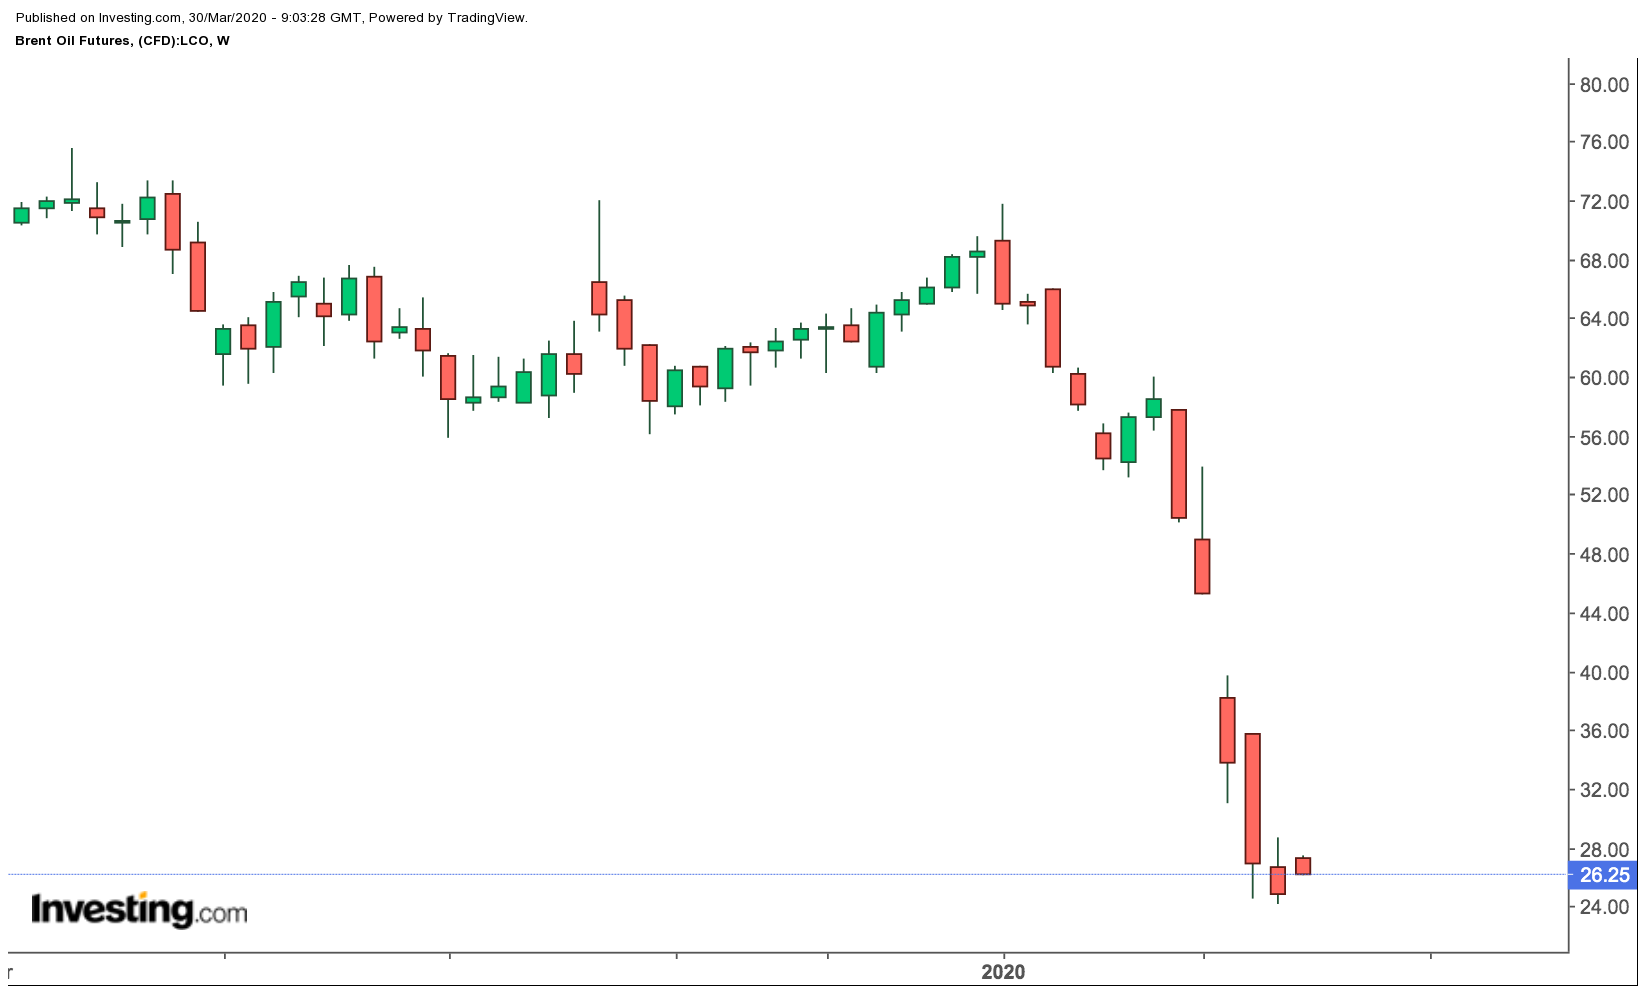
And it’s not just the U.S. industry that’s hurting. Crude at $20 is also causing severe pain to an already squeezed Saudi economy, which needs $80 a barrell. It's sending the budgets of other Middle East oil producers into a tailspin as well. Russia, meanwhile, is expected to suffer from a collapse in demand for its Urals, a heavy crude composition of oil produced in Ural, Western Siberia and Povolzhye that is more costly to produce gasoline from than from the lighter Brent, the global oil benchmark.
“The global economy is a complex physical system with physical frictions, and energy sits near the top of that complexity. It is impossible to shut down that much demand without large and persistent ramifications to supply,” Goldman said.
The Wall Street bank added:
“We believe the current oil crisis will see the energy industry finally achieve the restructuring it so badly needs. We have long argued that it is the supply and demand of capital that matters, not the supply and demand of barrels; as long as there is capital, companies can withstand difficult periods and the barrels always come back.”
Gold And Stocks In Tango
Gold and stocks are expected to be joined at the hip this week, with Wall Street likely to decide on the yellow metal’s direction, particularly if worries about the worsening U.S. COVID-19 situation sparks risk-off across markets. The United States overtook China last week as the country with the most number of coronavirus infections. As of Monday, there were more than 145,000 U.S. cases and over 2,500 deaths from the pandemic.
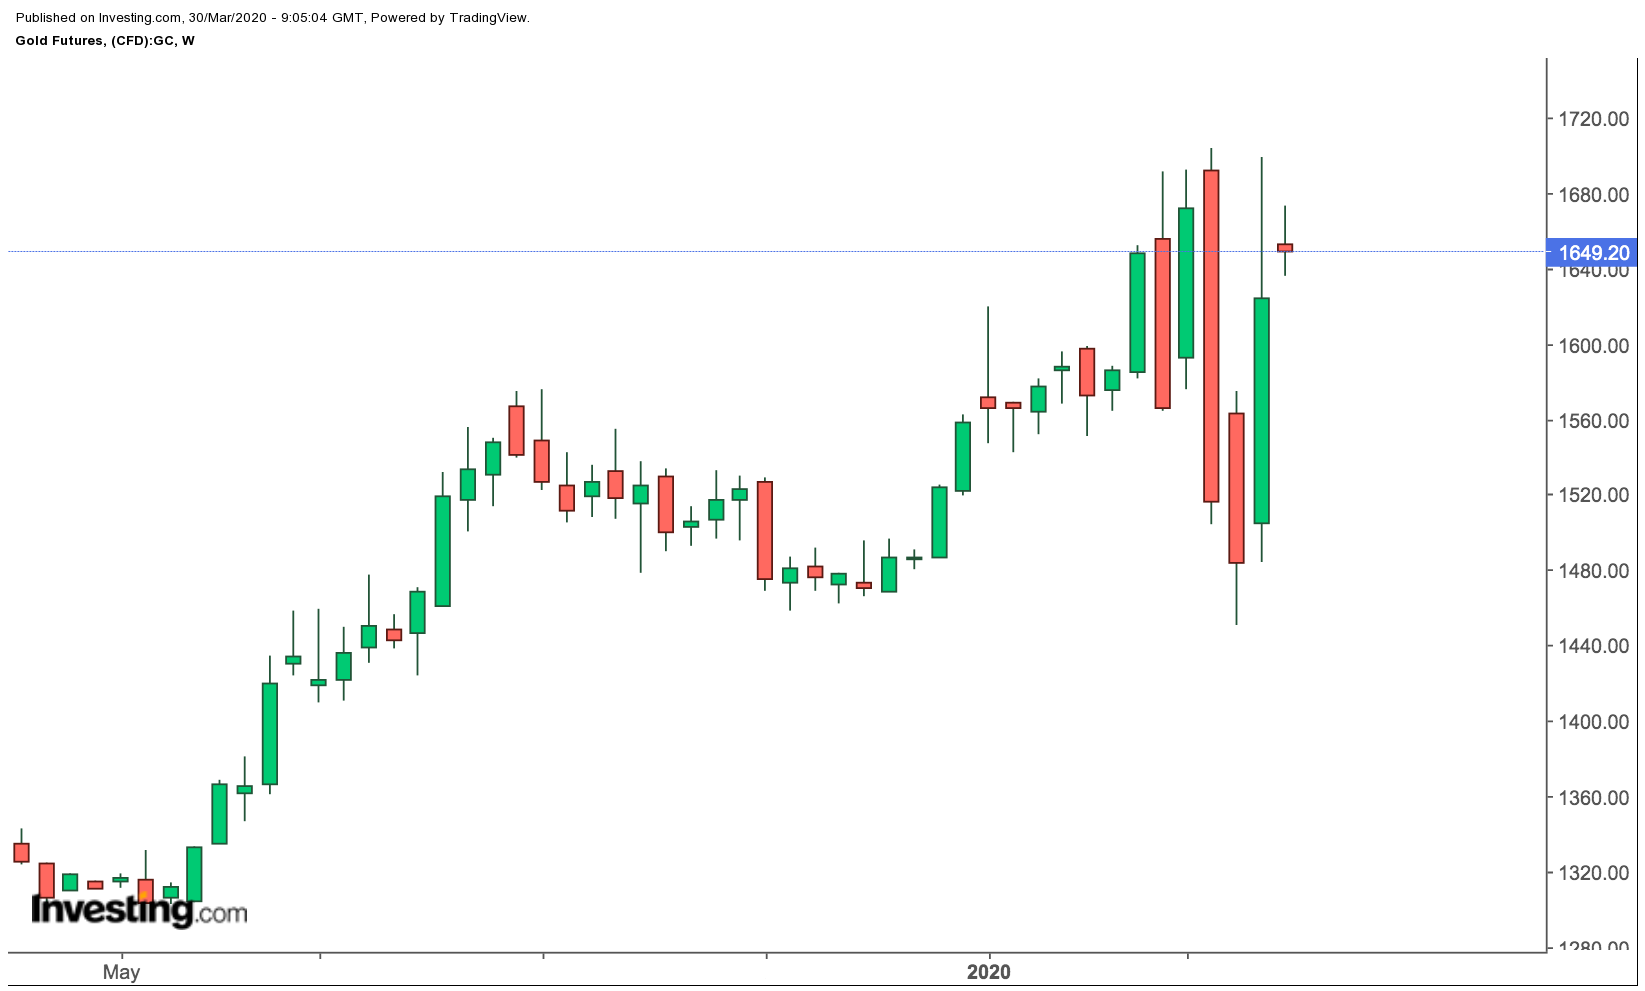
Gold futures for April delivery rose 9.5% to settle at $1,625 per ounce last week for its best week in almost 12 years last week. That was despite the market losing some of its luster on Friday as investors cashed in on a portion of the precious metal’s supercharged gains that came on the back of the $2 trillion U.S. stimulus approved for COVID-19.
All eyes would be on U.S. jobs data for March, due on Friday, where a loss of at least 100,000 jobs are expected. That comes on top of last week’s shock filing for first-time unemployment benefits by 3.3 million Americans.
“If anything, gold looks vulnerable to a deeper pullback below $1600.00 an ounce if equities do as expected, and underperform as the week gets underway,” said Jeffrey Haley, analyst at OANDA.
Haley adds:
“Although fundamentally, gold should be a screaming buy still, even after the dollar rally last week, nervous trigger fingers and a clear preference by global investors for cash mean that gold is unlikely to challenge $1,650.00 an ounce this week.”
