
This article was written exclusively for Investing.com
- Copper in middle of May 2021-August 2021 trading range
- Copper critical for decarbonization
- Demand vertical has changed fundamental equation
- New production could take a decade
- Buying copper on price weakness could be optimal approach
Before 2005, COMEX copper futures never traded above $1.61 per pound, and $1 was the pivot point for the industrial metal building block for global infrastructure. Copper is the leader of the nonferrous metals trading on the London Metals Exchange. Chile is the world’s leading producing country, and China has been the demand side of copper’s fundamental equation for decades.
In 2005, copper broke out on the upside, and the price has not ventured below the $1 level since 2003. The 2008 global financial crisis caused copper’s price to drop from a record $4.2160 per pound to a low of $1.2475 in seven short months. The liquidity and stimulus from the crisis created inflationary pressures that pushed copper to an even higher high of $4.6495 per pound in 2011.
In early 2016, copper fell below the $2 level, reaching a low of $1.9355 per pound on the nearby COMEX contract. As the worldwide pandemic gripped markets in early 2020, copper managed to hold at a higher low, as the price bottomed at $2.0595. The higher low was a sign, as the red base metal surged to a new record peak at $4.8985 in May 2021.
Since the most recent high, copper has digested the price appreciation and has consolidated chiefly above the $4-per-pound level. Copper’s rally may be far from over as the prospects for the red metal remain bullish as it sits above the $4.50-per-pound level, around 2.8 times the pre-2005 all-time high.
Copper In The Middle Of May 2021-August 2021 Trading Range
Since May, nearby COMEX copper futures have traded between $3.9615 and the May 2021 record peak of $4.8985 per pound. The midpoint of the range stands at the $4.43 level.

Source: CQG
The chart highlights the pattern of lower highs and higher lows in the copper market over the past months. Lower highs began with the May 2021 high and higher lows with the August 2021 low, when copper last probed below the $4-per-pound level. Copper has been consolidating around the midpoint of the trading range, with an upside bias.
Open interest, the total number of open long and short positions in the copper futures market, has risen from the 169,549-contract low on Dec. 20, when the price was below the $4.30 level. At over the $4.50 level on Feb. 16, the open interest metric stood at 210,089 contracts on Feb. 15, a 24% increase from the late December 2021 low.
Rising open interest while a futures contract has an upside bias tends to be a technical validation of a bullish price trend. Price momentum and relative strength indicators were sitting above neutral readings on the weekly chart as copper continues to consolidate and digest the move to a new record high last May. Weekly historical volatility declined from a high at more than 34% in 2021 to the 17% level as of Feb. 16.
The technical factors in the copper market suggest a healthy consolidation period that will eventually resolve to the upside.
Copper Critical For Decarbonization
Copper’s fundamental supply and demand equation has undergone a significant change over the past years. While copper is an essential metal and infrastructure building block, it added a new demand vertical as electric vehicles, wind turbines, and other green energy initiatives require the red metal for decarbonization projects.
Goldman Sachs analysts have gone as far as saying that copper is “the new oil,” as decarbonization does not occur without the base metal. Goldman has forecast the price would rise to the $15,000-per-ton level by 2025, putting COMEX futures above the $6.80-per-pound level, $2 above the current all-time high.
New Demand Vertical Has Changed Fundamental Equation
The emerging demand vertical is putting pressure on copper’s fundamental equation. As supplies struggle to keep pace with the increasing demand, inventories have been declining.
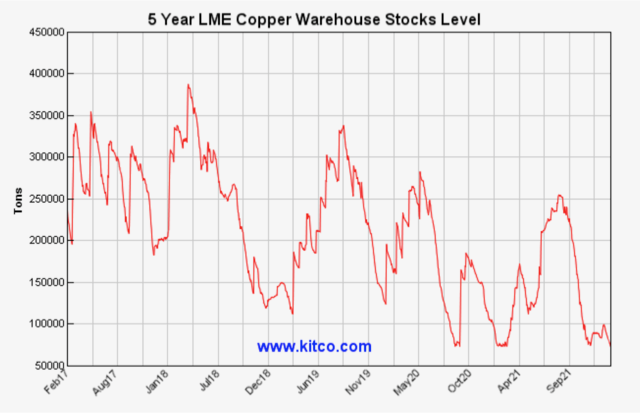
Source: LME/Kitco
The chart of copper inventories in London Metals Exchange warehouses worldwide shows a pattern of lower highs and lower lows, indicating rising demand. Copper stockpiles peaked at more than 380,000 metric tons in 2018. At the 70,125-ton level on Feb. 15, LME stocks were under 20% below the 2018 high and almost 33% below the 2021 peak. Falling inventories reflect increasing demand.
New Production Could Take A Decade
Commodity price cycles tend to take prices to highs and trigger increased production and rising stockpiles leading to price corrections as consumers reject the higher price levels. It takes eight to 10 years to bring a new copper mine into production in the copper arena. Declines in inventories tend to accompany markets that reach price lows, as consumers use bargain-basement prices as a buying opportunity.
Copper’s price rise, consolidation near the midpoint of the trading range since May 2021, falling stocks and increasing demand for decarbonization tell us that the price is building to new record highs over the coming weeks and months.
Buying Copper On Price Weakness Optimal Approach
Bull markets rarely move in straight lines, and corrections can be swift and brutal. Copper fell from nearly $4.90 per pound in May 2021 to a low below $4 in August, more than a 22.5% decline in four short months.
In 2008, the global financial crisis pushed the red metal from $4.216 in May to a low of $1.2475 in December, a more than 80% decline in seven months. After reaching the December 2008 low, copper proceeded to make higher lows and higher highs, leading to a new all-time peak above the May 2008 high in late 2010 and early 2011. The 2011 peak of $4.6495 stood as the record high until May 2021.
As supplies struggle to keep pace with the rising demand from copper’s new demand vertical, any price corrections are likely to create buying opportunities. As copper can become a falling knife when it declines, it is wise and prudent to leave plenty of room to add to long positions during price corrections, as picking bottoms or tops in any market is a dangerous exercise.
While Goldman Sachs projects copper will rise to more than $6.80 by 2025, picking tops is as hazardous as bottoms, as prices tend to overshoot even the most robust analysis on the up and downside.
Copper continues to be one of my favorite candidates for new all-time highs in 2022 as the fundamental and technical landscapes suggest that higher prices are on the horizon.