Interest rates haven’t been top of mind for investors for many years, not since before the 2008 Great Financial Crisis, due to the ultra-low rates ushered in by central banks in order to provide liquidity to stressed markets – a programme referred to as “quantitative easing.”
Quantitative easing, or “QE” for short, is the action of central banks’ printing money in order to purchase government bonds in the open market, thus artificially lowering yields.
QE is much like a shot of adrenaline, providing the financial market with a liquidity boost in times of uncertainty (e.g., the 2008 Great Financial Crisis or the 2020 surfacing of the Covid-19 pandemic). But here’s the problem, central banks have been shooting adrenaline into the markets for 10+ years, holding interest rates low for all those years.
In 2022, we finally saw the impact of sustained QE unfold into rising rates. However, the impact across the U.S. and Canada has differed. We explore why in this article.
Divergence between Canadian & U.S. Yields
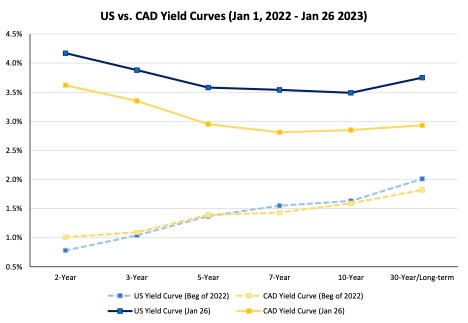
At the beginning of 2022, both the Canadian and U.S. yield curves looked very similar. Both were steepening over time and remained at essentially the same level.
Fast forward to today, both yield curves have inverted; however, the U.S. yield curve sits higher than the Canadian yield curve.

Source: Bank of Canada, U.S. Department of the Treasury
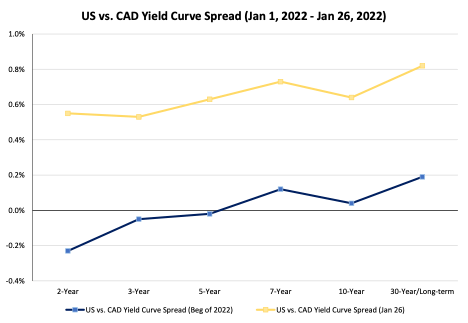
The U.S. Yield curve went from essentially having no significant difference to the Canadian yield curve a year ago, to now sitting an average of ~70 bps above the Canadian yield curve in every maturity.

Why does the yield curve matter?
The yield curve is very important since it is the government benchmark for every economic interest rate. When interest rates are rising, borrowing becomes more expensive—that means higher mortgage payments, higher car loan payments, less business borrowing, and less overall spending. These impacts act to slow down the economy and usually result in declining asset prices, which we’re sure everyone has experienced in their portfolios in 2022.
The yield curve is touted as the crystal ball of the economy, as it offers insights as to how investors are thinking of:
- Inflation expectations
- Economic growth expectations
- Policy rate expectations
Thus, in general, an inverted yield curve (like we currently have now) is a sign of lower inflation expectations, lower growth expectations and lower policy rate expectations.
The divergence between the U.S. and Canada yield curves also captures the differences in how market participants are thinking of each country’s inflation, growth and policy rate expectations.
Why is the divergence between the U.S. and Canada yield curves happening?
Overall, the Federal Reserve has hiked interest rates more aggressively than the Bank of Canada, even though both countries have reported very high inflation rates.
The problem for Canada is that the average Canadian citizen carries more debt than the average American citizen, thus making them much more susceptible to interest rate fluctuations. The Bank of Canada is cognizant of this and has decided to hike rates at a more controlled pace.
Another overlooked factor is that the Federal Reserve carries more global responsibility. Given that the U.S. Dollar is the world’s dominant reserve currency, the Federal Reserve must control inflation expectations or the U.S. Dollar could lose its value and cause a global financial/economic meltdown. This has led the Federal Reserve to hike more aggressively as well.
ETF Ideas for a closing divergence gap
Divergences don’t last forever, and the divergence between the two neighbouring countries’ yields could eventually close, especially if inflation rates across both countries moderate.
A trade idea could be:
- to invest in long U.S. bonds, as their price will increase if yields fall
- to invest in short Canadian bonds, as they will outperform if yields rise or remain stagnant
This can be accomplished for Canadians with ETFs, such as:
BMO (TSX:BMO) Long-Term US Treasury Bond Index ETF (ZTL.F)
- AUM: $245 million
- Expense Ratio: 0.22%
- 1mo Performance: +4.5%
iShares Canadian Short Term Bond Index ETF (XSB)
- AUM: $2,645 million
- Expense Ratio: 0.10%
- 1mo Performance: +1.2%
Data as of January 26, 2023.
This content was originally published by our partners at the Canadian ETF Marketplace.
