Last week we wrote that Gold’s poor performance in real terms could reflect its worsening fundamentals. Real interest rates are rising because the rate of inflation has peaked and bond yields are rebounding. It is a double whammy for precious metals. This is not permanent but something that could last a few quarters. Gold needs inflation to accelerate or bond yields to drop significantly. One historical analog argues that with respect to the Federal Reserve, a change in policy could be part of the fundamental shift needed to drive Gold into a bull market.
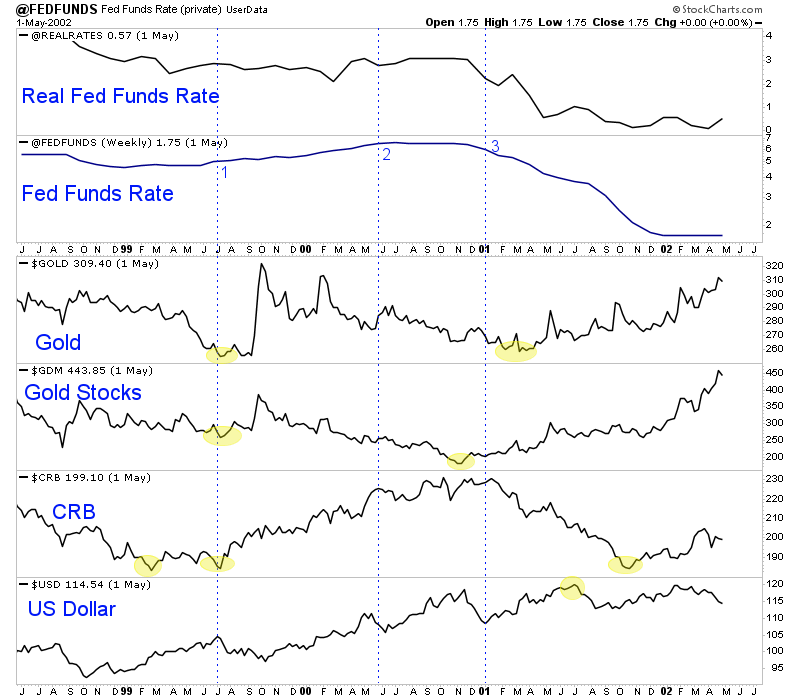
The best analog for current Fed policy and market performance could be the 1999 to 2000 rate hike cycle. In the summer of 1999 the Federal Reserve hiked rates for the first time in more than two years. It wasn’t the nine year drought between 2006 to 2015 but the hike was well telegraphed and it came amid a nasty bear market in Gold and hard assets. Gold, gold stocks and commodities rallied after that first hike but were unable to sustain it as the Fed would hike five more times. The stock market though continued much higher as Gold and gold stocks turned lower.
Sound familiar?
Take a look at the chart below which plots a number of markets along with the Fed funds rate and real Fed funds rate. Point 1 is where the Fed restarted hikes, point 2 is the final hike and point 3 is the rate cut.

Gold and gold stocks began their bull market around the time of the Fed’s next rate cut which is also when real interest rates began to decline considerably.
With respect to Federal Reserve policy, precious metals need the Federal Reserve to move from a pause in rate hikes to a cut.
We have written about Gold’s long-term negative correlation to the stock market and why Gold needs a bear market in stocks and economic weakness. Those things would force the Fed to pause their rate hikes and move towards cuts. Include increased government spending and you have the recipe for a sharp decline in real rates and the start of a new bull market in Gold. Unfortunately, these developments are much more likely to be a 2018 story than a 2017 story.
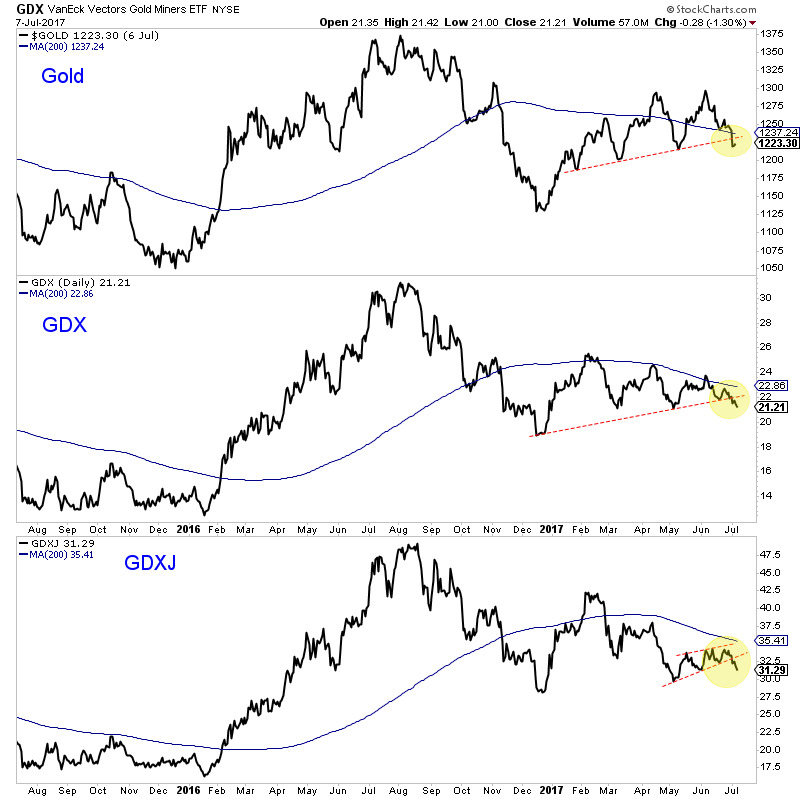
Here and now, the outlook for precious metals remains strongly bearish. silver broke its December 2016 support and is trading at a new 52-week low. The miners could reach such levels in the coming months. Again, a close in VanEck Vectors Gold Miners Fund (NYSE:GDX) below $21.00 triggers a downside target in the high $16s. VanEck Vectors Junior Gold Miners (NYSE:GDXJ) has broken down from a bear flag and is now leading on the downside. The first stop for miners could be the December lows with Gold following suit.

For now, Gold’s fundamentals are bearish and that is reflected in the very bearish charts. A study of history and the 1999-2001 Fed cycle could help us pinpoint when the fundamentals turn in Gold’s favor.
We will continue to keep an eye on that as well as the charts. The risk continues to favor lower levels in precious metals so bulls and bugs should raise cash, stand aside and research what could be the best buys in the months ahead.
