Oil surged Thursday after reports Saudi Arabian officials were holding discussions with other oil producers about possible market intervention to stabilize falling prices. Exporters have already been cutting production more than previously agreed in an attempt to support prices but have so far failed to halt the slide.
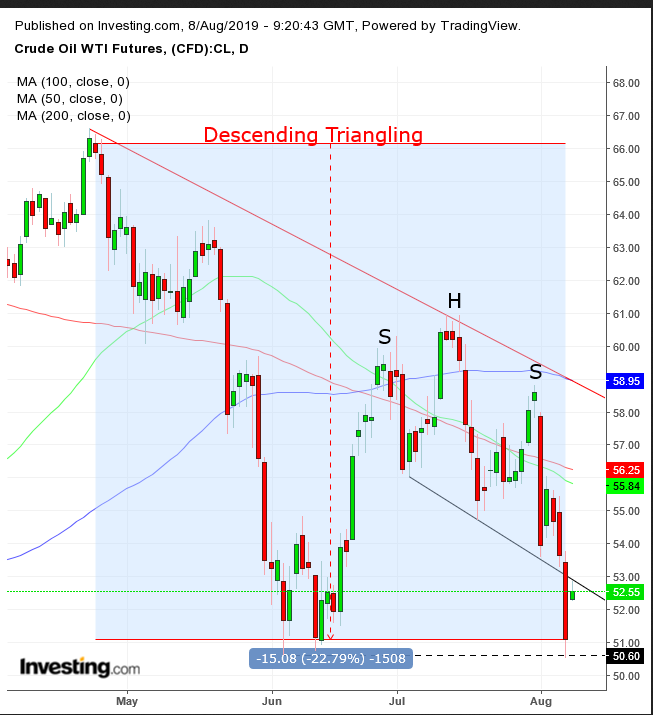
Indeed, despite OPEC+ action, crude fell into bear market territory, dropping 22.8% between the April 23 peak and Wednesday’s close. While arbitrary, a bear market status assigns psychological power to bears.
The main reason for the decline has been falling demand on recession fears, much of which is blamed on the trade war. That begs the question, though: why has the equity recovery on trade easing not caught up with the oil market? Is it because oil investors are more pessimistic than stock and bond traders about a trade resolution?
Is it because the decline was not, in fact, altogether due to trade, rendering its easing moot? Or is it because the market has been so battered that traders no longer care to find reasons – in other words, a loss of faith?
While we don’t know the answers to those questions, we do know that the trading patterns are on the verge of completing multiple bearish price structures.

The price completed a down-sloping H&S continuation pattern, demonstrating that the bull-bear tug of war ended with the prevailing downtrend.
The 50 DMA fell below the 200 DMA, triggering a death cross and reinforcing the H&S bearish implication. Completing a down-sloping top is difficult, as the price plunge must accelerate to overtake the falling neckline. Its ability to do so demonstrates panic.
Despite today’s 2.25% jump, the price found resistance by the neckline, taking a step back. The June lows supported the price yesterday, before today’s intervention news. However, if the price proceeds to fall below $50, as the H&S suggests, it will complete a second, larger pattern: a descending triangle.
This chart reflects that sellers are growing more eager than buyers. A downside breakout would demonstrate that the dynamic resumes after supply drowns out demand and sellers reduce offer prices to find new, willing buyers at better deals. In that case, an even larger pattern would complete.

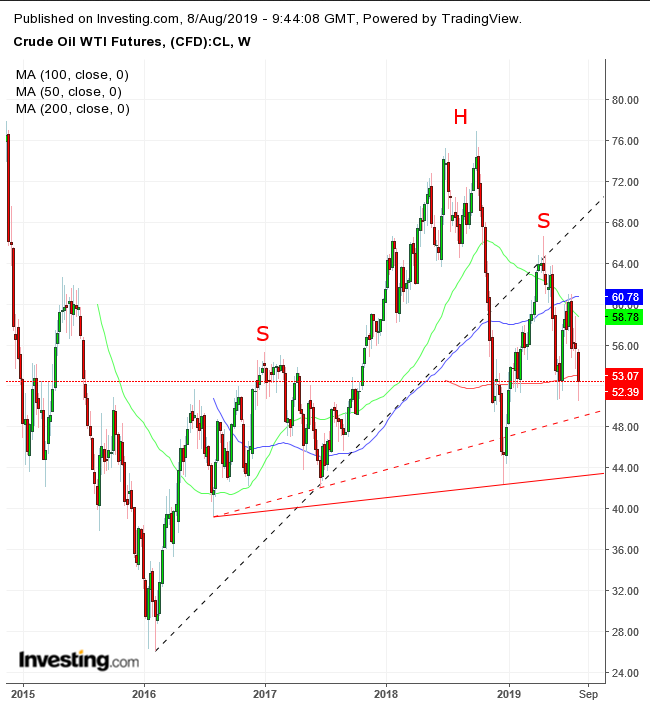
A break below $50 may complete a massive H&S continuation pattern since July 2016, according to one interpretation of where its neckline should be, if it's hugging the price action at the expense of what may be considered a fake-out December 2017 (red dotted line).
Perhaps, a more puristic interpretation would demand that prices fall below the neckline that includes all price action, even if it doesn’t touch it all till that point (solid red line). That neckline would probably meet with falling prices in the mid-$40s range. Completing this massive H&S continuation pattern would signal a resumption of the long-term downtrend since the 2008 crash.
Additional evidence to support a bearish outlook: The price fell during November 2018 below its uptrend line since the 2016 bottom, to visibly confirm its new resistance with repeated failed attempts to climb back above it during April. Also, the price is below the 200-week MA for the first time this year, after the 50-week MA fell below the 100-week MA, showing a price breakdown on different levels.
If the massive H&S pattern completes it would show that the market is willing to retest the February 2016 lows of $26.05, and if those don’t hold up, we’re liable to look at prices we haven’t seen this century, ranging around the $10-$20 levels.
Trading Strategies
Conservative traders should wait for a fall below the stricter neckline of the weekly H&S to short or for new highs above the October 2018 peak of $76.90 to go long.
Moderate traders may short with a downside breakout of the tighter neckline, below $50, for a short, or for a blowout of the descending triangle over $61 for a long position.
Aggressive traders would short with additional firming – on news of actual OPEC+ intervention and/or further trade easing – to short by the neckline of the small H&S, at around $54.
Trade Sample
- Target: $51, above June low and yesterday’s support
