Investing in equities, when done right, can provide unparalleled returns. But unless an investor has a specific stock they're focused on, there's another question that should be asked before any targeted choices are made. Is it better to invest in large- or small-cap shares?
Large-cap is the commonly used vernacular for companies whose stocks have large market capitalizations, meaning valuations above $10 billion. Small-caps are the exact opposite: companies with a smaller market capitalization, often valued at up to $2 billion.
Both types of shares have their own benchmark indices. Large-caps are listed on the much-watched S&P 500, while the small-cap index of choice is the Russell 2000. The median market cap for companies listed on the S&P 500 is $22 billion, whereas companies listed on the Russell 2000 have a median market cap of $800 million.
Apple (NASDAQ:AAPL), Microsoft (NASDAQ:MSFT) and Amazon (NASDAQ:AMZN), which are all listed on the S&P, each hit valuations of $1 trillion, garnering considerable investor and media attention. Conversely, it’s very possible you’ve never heard of The Trade Desk (NASDAQ:TTD), Cree Inc (NASDAQ:CREE) and Coupa Software (NASDAQ:COUP), three of the largest Russell 2000 components.
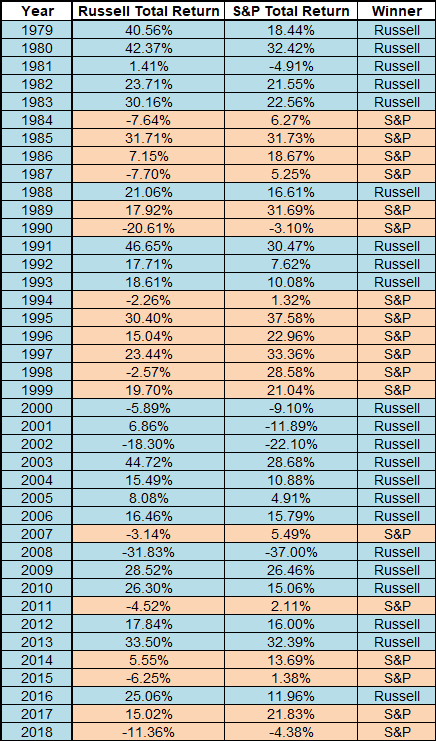
Over the past decade, it has become conventional wisdom that small-caps usually outperform large-caps. But do they really? Here's what we discovered from the data below, which lists the annual total returns (dividends included) of both the S&P 500 and Russell 2000.

First, note that based on results over the past 40 years—the timeframe for which the Russell 2000 data was available—the small-cap index outperformed the S&P 500 22 times; the S&P bested the Russell 18 different times. Overall, then, it seems pretty balanced.
Second: outperformance seems to be cyclical. Data shows, the Russell generally outperformed between 1979-1983, 1991-1993, 2000-2014, while the S&P outperformed between 1984-1990, 1994-1999, and 2014-2018. Breaking these periods down further, a pattern emerges.
The Russell 2000 outperformance coincides with economically troubled times in the U.S.:
- 1979-1983: Double-digit inflation, plus during 1980 and 1982, recessions.
- 1991-1993: 1990-1991 Recession
- 2000-2014: Tech bubble, subprime crisis
The S&P 500 outperformed when the U.S. economy was strong:
- 1984-1990: 1980’s boom, leading to the 1990 recession
- 1994-1999: Mid 90’s economic expansion, leading to the tech bubble
- 2014-2018: Economic expansion after recovery from the 2008 crisis
Of course, the correlation between the performance of the indices isn’t absolute. Some years the results are counterintuitive to this theory. Still, the correlation is strong enough to indicate that when the economy is expanding, go with large-caps. However, when economic conditions get tough, go with small-caps.
And since we’ve already crunched the numbers, here's the answer to a likely secondary question: if you had invested $100 dollars in both the Russell and the S&P during January 1979, which investment would have made more money?
On January 2019, our final data point, you would have seen a return of $6,759 from the Russell, $7,835 for the S&P. But the flow of returns was also time-dependent. The Russell took the lead from the beginning of the period examined until 1989. In 1989, the S&P took over, until 2010.
The strong recovery of the Russell 2000 after the tech bubble and subprime crisis allowed it to retake the overall lead in 2010, only for that to be squandered in 2014 when the S&P came roaring back to dominance, where it remains to this day.
