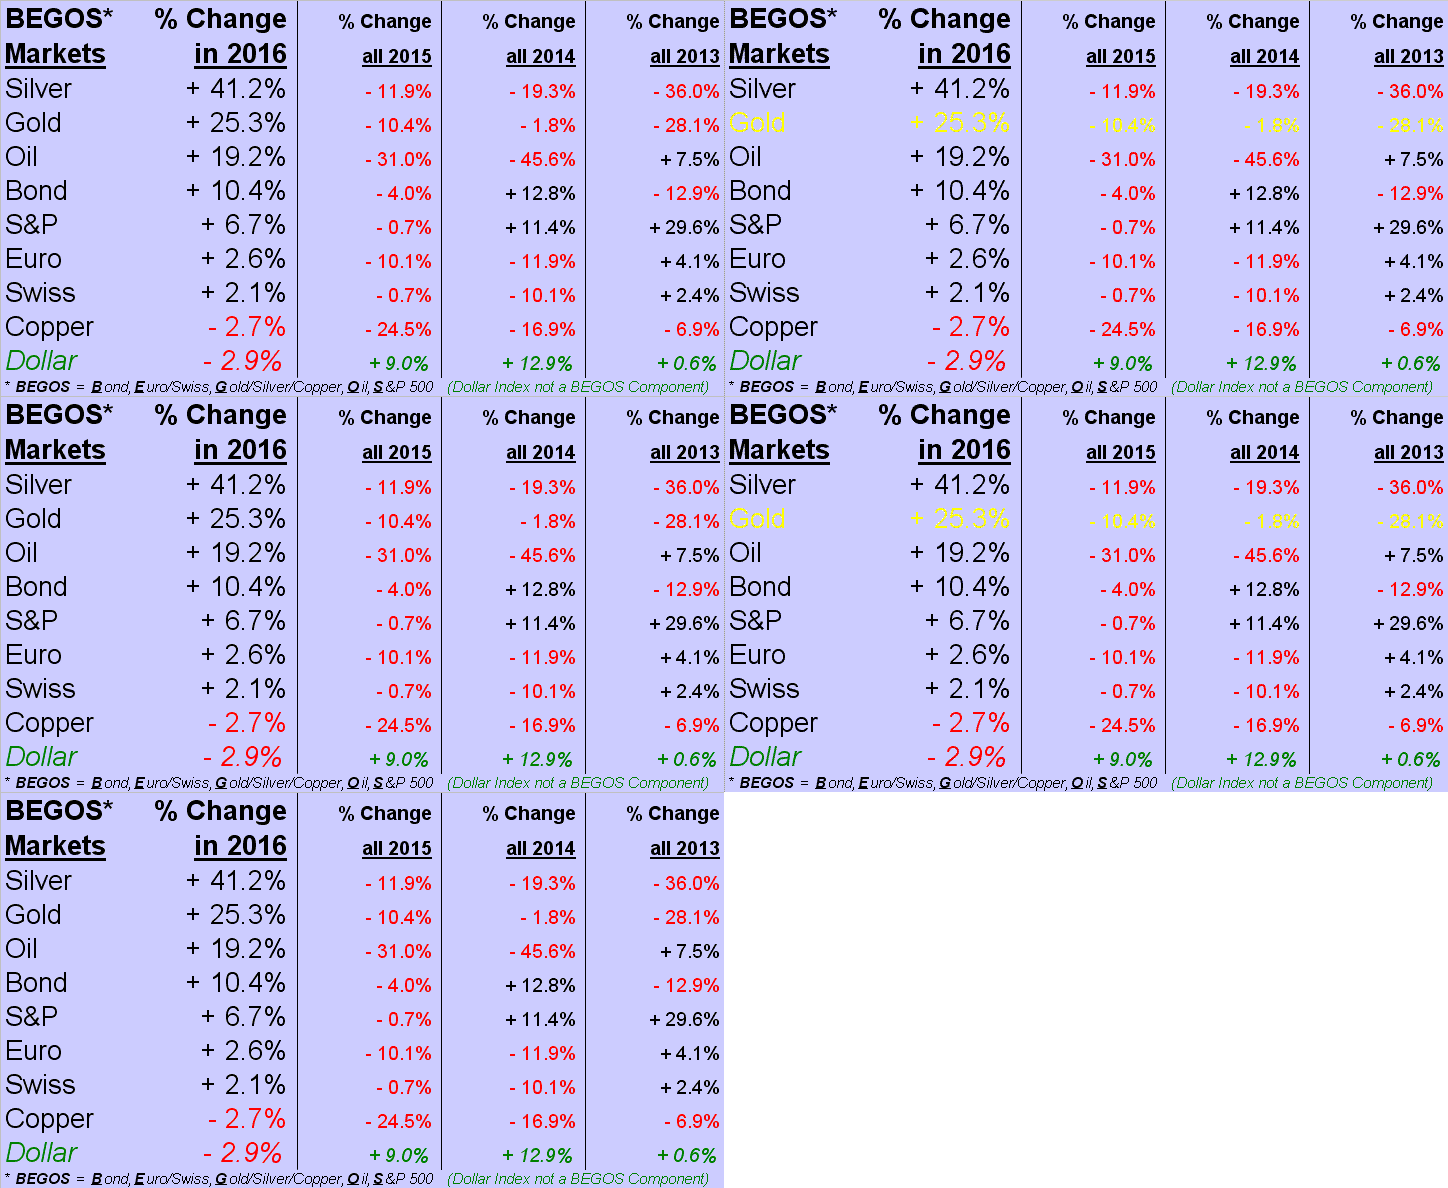
North of the equator, we've but 19 days left of summer, the year speeding past: 'tis already September! And, oh, what a year for the precious metals' performances which -- as measured over the past four decades -- are as top tier as they can appear! So now with two trimesters plus two days in the trading books for 2016, here are our year-to-date BEGOS Markets standings:
Moreover, another month having passed, let's look at Gold's comparatively docile year-over-year percentage track, +18%, versus those of its high-level equities brethren: Goldcorp Inc (NYSE:GG) +20%, Franco-Nevada Corporation (TO:FNV) +75%, GDX (NYSE:GDX) (the prominent exchange-traded fund of the Gold miners) +104%, SIL (the popular exchange-traded fund of the Silver miners) +141%, and NEM (Newmont Mining (NYSE:NEM)) +150%. Still lagging under managerial massaging, 'tis said that GG will be Go-Go as their structural improvements take hold:
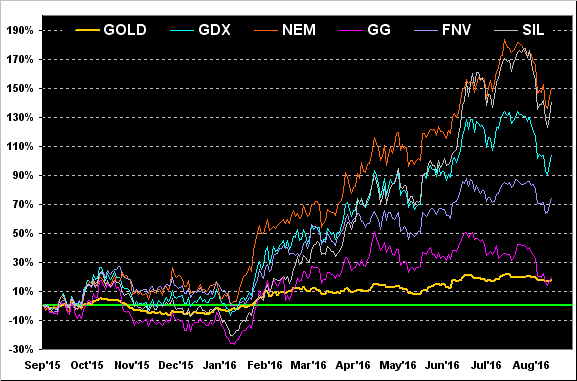
Note, too, that GDX's bright blue track is also representative of its year-to-date performance (+99%, and as much as +131% upon price having touched 31.79 on 12 August): a sound doubling so far this year for "the miners". We point this out per that which was just received from a highly-valued reader: "Most gold guys don't know or have forgotten since 2004 when the miners last really delivered on their promise of out-performance of the metal ... If gold hits $ 1500 this year, the miners could double again THIS YEAR." A bit of a mathematically optimistic stretch one might say, given the present year-to-date growth ratio of GDX/Gold is 3.9x ... but then there's the overshoot ... Ka-Ching!
'Course, if Gold were to settle this year at 1500 (+41%), 'twould be its sixth best performance since President Nixon's 1971 Gold-standard nixing, after which price in 1972 rose +43%. And for those of you scoring at home, the other bettering years were 1979's +59%, 1974's +64%, 1973's +67%, and 1980's +100%. From our more modest purview for this year's balance, we remain curious as to Gold's course upon its regaining Base Camp 1377, our revised projected high which to date has precisely held. Hopefully, 'twill prove us wrong.
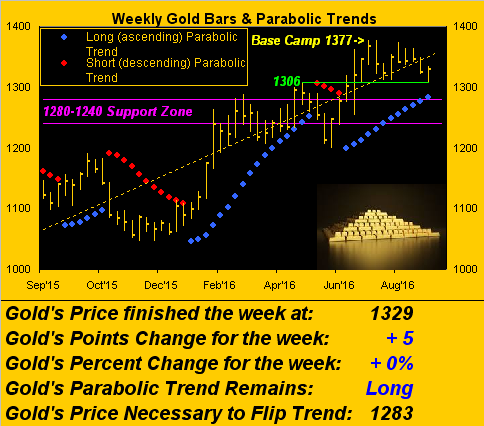
In the interim, the trend remains Gold's friend: as we next see by the weekly bars, the linear regression trend (dashed line) is in brilliant ascent, as continues the parabolic Long trend of the ascending blue dots. The 1306 structural supporter (green line) was essentially twice-tested during first two days of September, with price repelling back up to settle out the week yesterday (Friday) at 1329:
To be sure, there were expectations had the StateSide August payrolls number (+151,000) been more robust, 'twould have resulted in, as a dear reader wrote, "goodbye gold ... Fed's could raise in September". To which I responded: "My 'funnymental' sense is that [they] shan't raise for the foreseeable future. They're stuck; probably need to re-organize, re-invent themselves." Or in replying as queried during last Sunday's Investors Roundtable as to if the Fed would raise interest rates during 2017. "No." (I like easy questions). Add to that the Bloomy interview on Tuesday with FRB Vice Chairman Stanley Fisher, with all due respect during which the responses were mainly mental mush, and the markets moved nary a wit.
Still, the year's stalwart run for Gold and Silver remains silently buried in the financial news flow, if for no other reason than "nobody" owns such multi-millennia-proven assets. Rather, incessant media machinations remain of adapting practically anything and everything into how it might sway members of the Federal Open Market Committee into "raising" their central bank's overnight lending rate in just 18 days on 21 September; else so do in December, (their November pre-election get-together not even mentioned in the conversation: heaven forbid their first nicking up the rate, the stock market then tanking, Mr. Trump then winning, and the FedFolks then hearing "You're fired!"). And yet MarketWatch reported this past week that the "U.S. Economy Is Providing Ammo for Higher Interest Rates Ahead." What do you think?
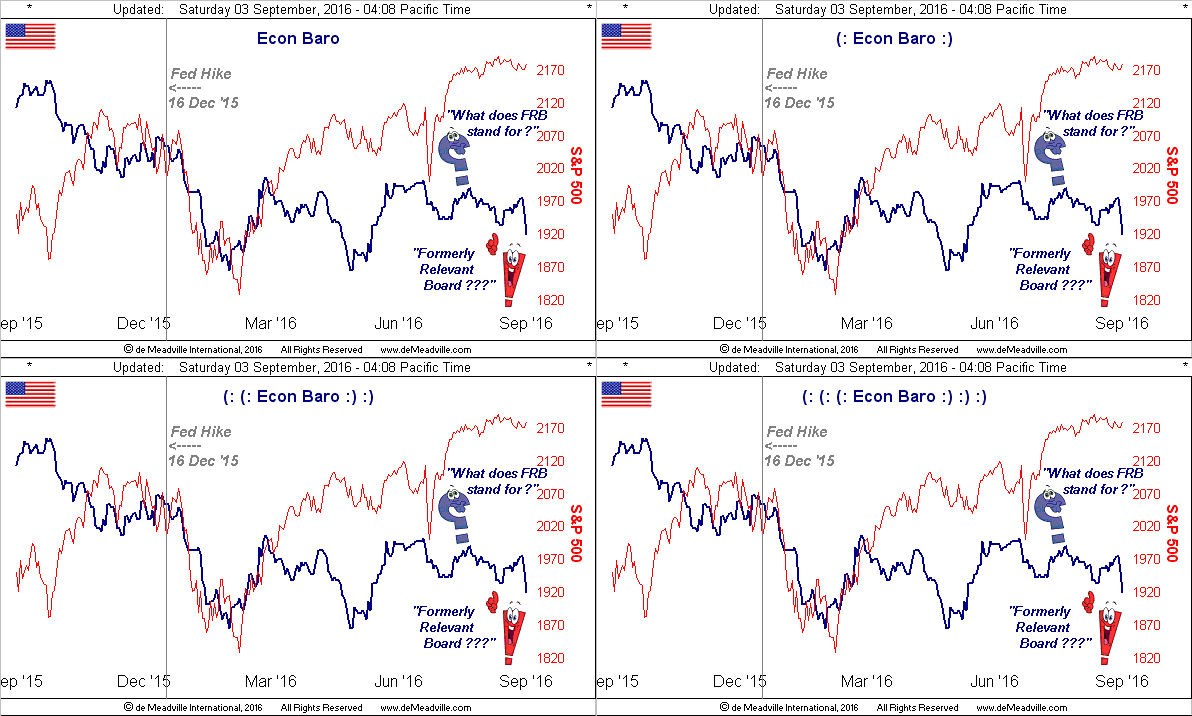
"Jeepers, mmb, the jobs data caused that plunge?"
Squire, 'twas more than just the aforementioned payrolls for which growth declined. It also declined in the average hours worked per week and in hourly earnings. But wait, there's more: the Chicago Purchasing Managers' Index weakened; the Institute for Supply Management's manufacturing index contracted sub-50 for the first time since February; construction spending went flat; vehicle sales declined; and Q2 productivity was revised to an even more negative number. All that "quantitative easing" and look what we've got: 46 million folks between the ages of 20 and 65 out of work (per Pulitzer Prize-winning Politifact), and a stock market set to halve itself simply to find reasonable valuation to its earnings (per our "live" price/earnings ratio of the S&P at 37.9x). Got Gold?
And 'tis not just here: this Thursday's European Central Bank meeting shall find its members grappling with further EuroZone economic deterioration, following August's failed inflation acceleration. And not since October of 2013 have there been such low readings of business confidence in the Zone. Moreover, manufacturing across Europe (save for a British up-blip) and Asia remains wobbly, demand being described as "fitful at best." Clearly, 'tis not all happening there.
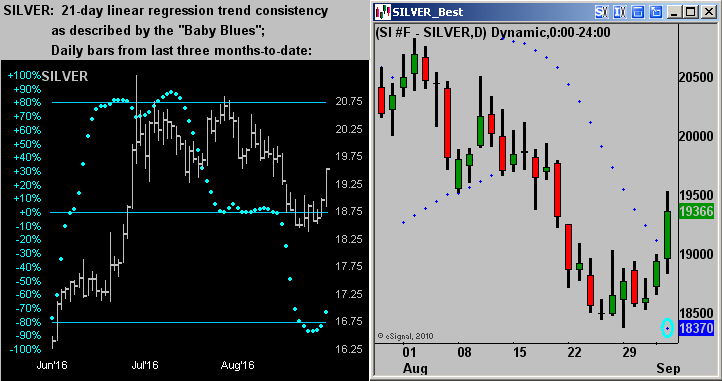
What is happening for the precious metals are some improvements in their near-term technicals. And since Sister Silver is still atop the BEGOS Markets standings, she gets top billing in her below two-panel view. On the left is the familiar view of Silver's daily bars for the past three months, the baby blue dots being the consistency at each day's measuring of the 21-day linear regression trend: and those "Baby Blues" are curling upward. On the right we've Silver's daily bars from August-to-date: note that the dark blue dots, which are the bars' parabolics, have just flipped to Long, the newest dot (yesterday's) being encircled; this suggests Silver ought move at least up into the mid-chart price bunching around the 20 area:
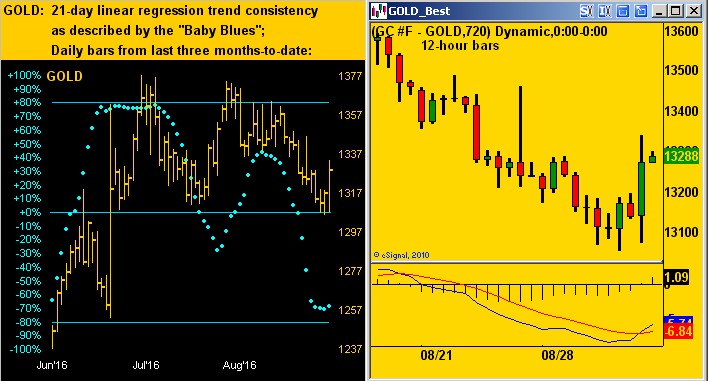
Similarly below for Gold, on the left are its three months of daily bars and a like up-curling of the "Baby Blues", whilst on the right are the 12-hour bars since 18 August, their MACD ("moving average convergence divergence") study beneath the chart just having confirmed a positive crossover, our "Market Rhythm" data there suggesting a run up to at least 1360:
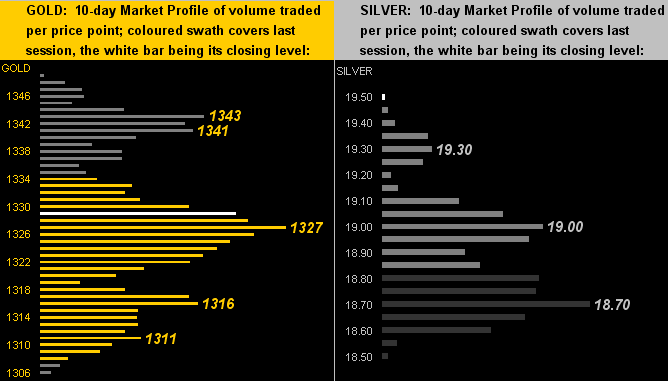
As for both markets' 10-day Profiles here they are with Gold's (left) and Silver's (right); nice to note that yesterday's settles are no longer near the bottom of the respective Profiles, indeed that Silver's is the wee white bar at the top of her stack:
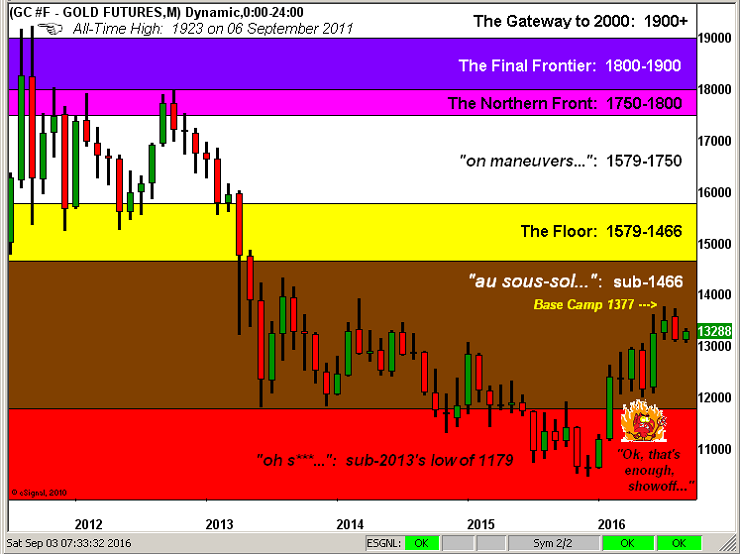
Finally, passing from one month to another wouldn't be the same without our big picture view of Gold's layer-defined structure. So here 'tis, Gold by the month since its All-Time High, the fifth anniversary for which is Tuesday! Gold's low since then down to 1045 this past 03 December was a decline from 1923 of 878 points or nearly -46%. Today, just a human gestation period later, Gold has recovered 284 of those lost points, or +27%. Still, quite the long upside row to hoe, what? And yet year-to-date, 'tis been a fabulous run. As for that little fellow down at lower right, may his impatience be eternal:
Finally, by now you've doubtless read the United Kingdom's SMC ("Social Mobility Commission") report on "Socio-Economic Diversity in Life Sciences and Investment Banking." (And you roll your eyes at where our StateSide taxpayer money is spent?). Fairly startling results that apparently one still requires being dressed in the conservative polish of a dark pinstriped suit, white shirt, black shoes and correctly-knotted tie to have any hope of gainful employment as an investment banker in The City.
Nice that the time-honoured song from 1939 "There'll Always Be an England"continues to will out. 'Twas much the same here in San Francisco's busy-as-a-bee financial district for many decades, our Wall Street West streets a buzzing hive of starched and properly-pressed business garb ... until "dress-down Friday" came into being about a generation ago, which over recent years has morphed into "Slobby Sot Everyday". To wit, this shot of the district's Montgomery Street subway station at rush-hour. Do you realize that any one of these folks just might be runnin' yer dough? Got Gold?
"But c'mon, mmb, you yourself practically live in tennis sweats, eh?"
Principal's prerogative, Squire. (And since you don't own a single tie, I've plenty to lend to you).
Wednesday brings us the latest edition of the Fed's "Tan Tome". Shall it defy the Econ Baro? Got Gold?