Gold Due For A Bounce, But Remains In Long-Term Bearish Trend

Published 2016-12-26, 07:35 a/m

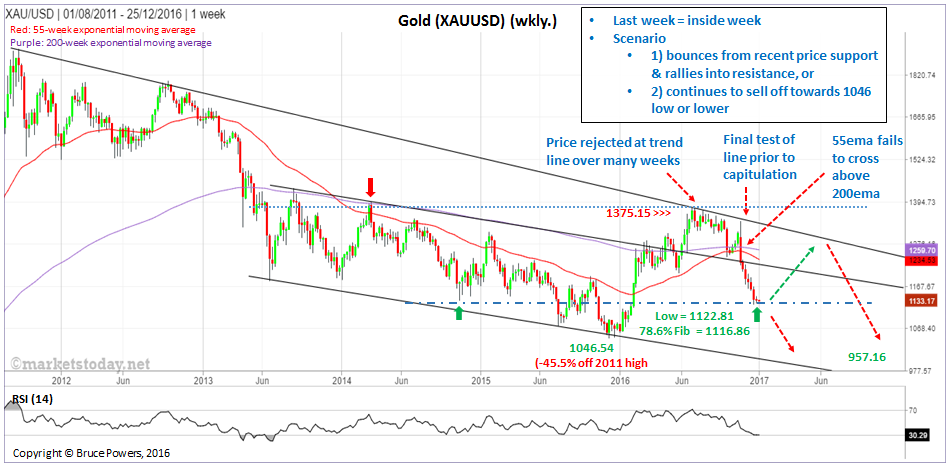
Spot gold (XAU/USD) remains in a long-term downtrend following a test of resistance at the long-term downtrend line over multiple weeks from July to September, and then again in November. A swing high of $1,375.15 was reached during that time, which was also a 2016 high and the highest price since March 2014.

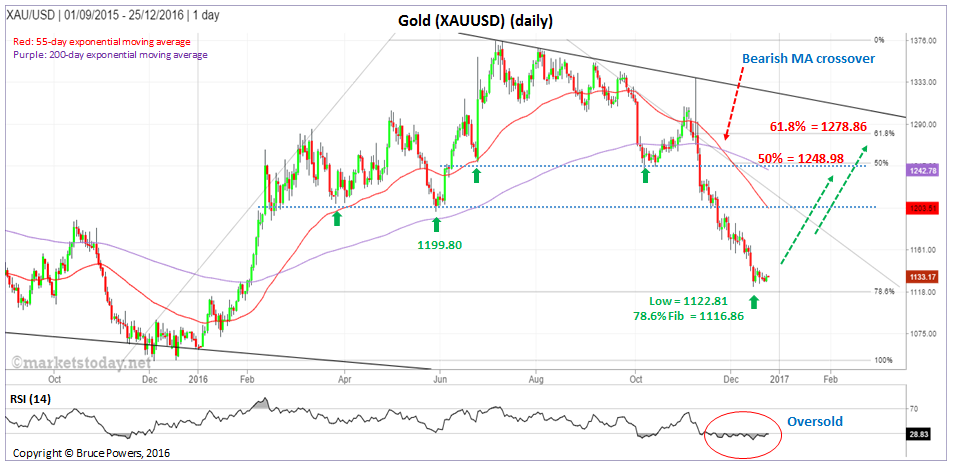
Eventually, buyers capitulated and the precious metal fell decisively for six weeks until hitting a low of $1,122.81two weeks ago. Essentially, that decline completes a 78.6% Fibonacci retracement ($1,116.86) of the uptrend begun from the 2015 low. Although there is no real bullish divergence on the 14-day RSI so far, it has been oversold for the past month.
XAU/USD Weekly Chart

Until proven otherwise the long-term downtrend can be anticipated to continue- eventually.

Price remains below the long-term downtrend line. 55-week exponential moving average (ema) was unable to cross back above the 200-week ema. It has remained below the 200-week ema since December 2013. Price got above the 200-week ema for much of 2016 after falling below it in 1Q 2013, but is now decisively back below the 200-week ema.

Near-term positive

Regardless, given the analysis in the first paragraph above, in the near-term there is a reasonable chance for a decent bounce, and possibly another test of resistance of the long-term downtrend line.Fibonacci retracements of the current short-term decline can be used as potential targets and to correlate with the downtrend line once it is approached. The 50% retracement level is at $1,248.98, and the 61.8% price level is at $1,278.86, and can be seen on the following chart.
XAU/USD Daily Chart

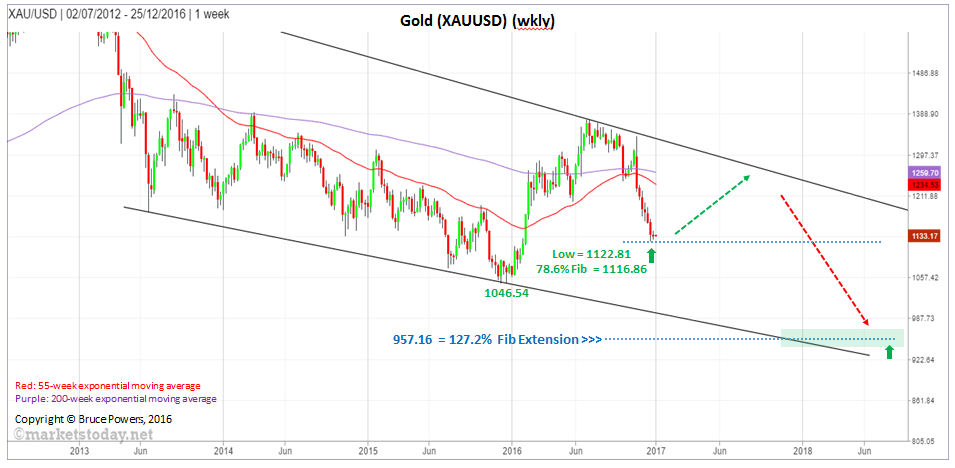
Long-term lower target at 127.2% Fibonacci extension

If the long-term downtrend remains intact going forward and the 2015 low of $1,046.54 is eventually exceeded to the downside gold could easily reach the 127.2% Fibonacci extension of the uptrend off the 2015 low. That extension is at $957.16 and is a minimum lower target.
XAU/USD Weekly Chart 2

Latest comments

Loading next article…
Risk Disclosure: Trading in financial instruments and/or cryptocurrencies involves high risks including the risk of losing some, or all, of your investment amount, and may not be suitable for all investors. Prices of cryptocurrencies are extremely volatile and may be affected by external factors such as financial, regulatory or political events. Trading on margin increases the financial risks.
Before deciding to trade in financial instrument or cryptocurrencies you should be fully informed of the risks and costs associated with trading the financial markets, carefully consider your investment objectives, level of experience, and risk appetite, and seek professional advice where needed.
Fusion Media would like to remind you that the data contained in this website is not necessarily real-time nor accurate. The data and prices on the website are not necessarily provided by any market or exchange, but may be provided by market makers, and so prices may not be accurate and may differ from the actual price at any given market, meaning prices are indicative and not appropriate for trading purposes. Fusion Media and any provider of the data contained in this website will not accept liability for any loss or damage as a result of your trading, or your reliance on the information contained within this website.
It is prohibited to use, store, reproduce, display, modify, transmit or distribute the data contained in this website without the explicit prior written permission of Fusion Media and/or the data provider. All intellectual property rights are reserved by the providers and/or the exchange providing the data contained in this website.
Fusion Media may be compensated by the advertisers that appear on the website, based on your interaction with the advertisements or advertisers.
© 2007-2025 - Fusion Media Limited. All Rights Reserved.