Another lockdown scare in the U.K. and more dovish remarks expected from the Federal Reserve haven’t done as much for gold as they’ve done for the dollar.
The dollar index was up late Tuesday afternoon in Asia, extending the 0.8% gain in the previous session, when COVID-19 fears and worries over the US Congress’ stimulus impasse drove a selloff across other assets.
More importantly, the index, which pits the dollar against the euro, yen, pound, Canadian dollar, Swedish krona and Swiss franc, has held above the bullish 93-handle for most of the past two months.
“The US Dollar is gaining considerable ground to start the week as stocks slide further,” Rich Dvorak, currency analyst, said in a blog on Daily FX. He added:
“USD price action tends to rise during periods of risk aversion due to its posturing as a top safe-haven currency. This is boosting the DXY Index as the US Dollar strengthens across the board of major FX peers like the EUR, GBP, CAD, and AUD to name a few.”
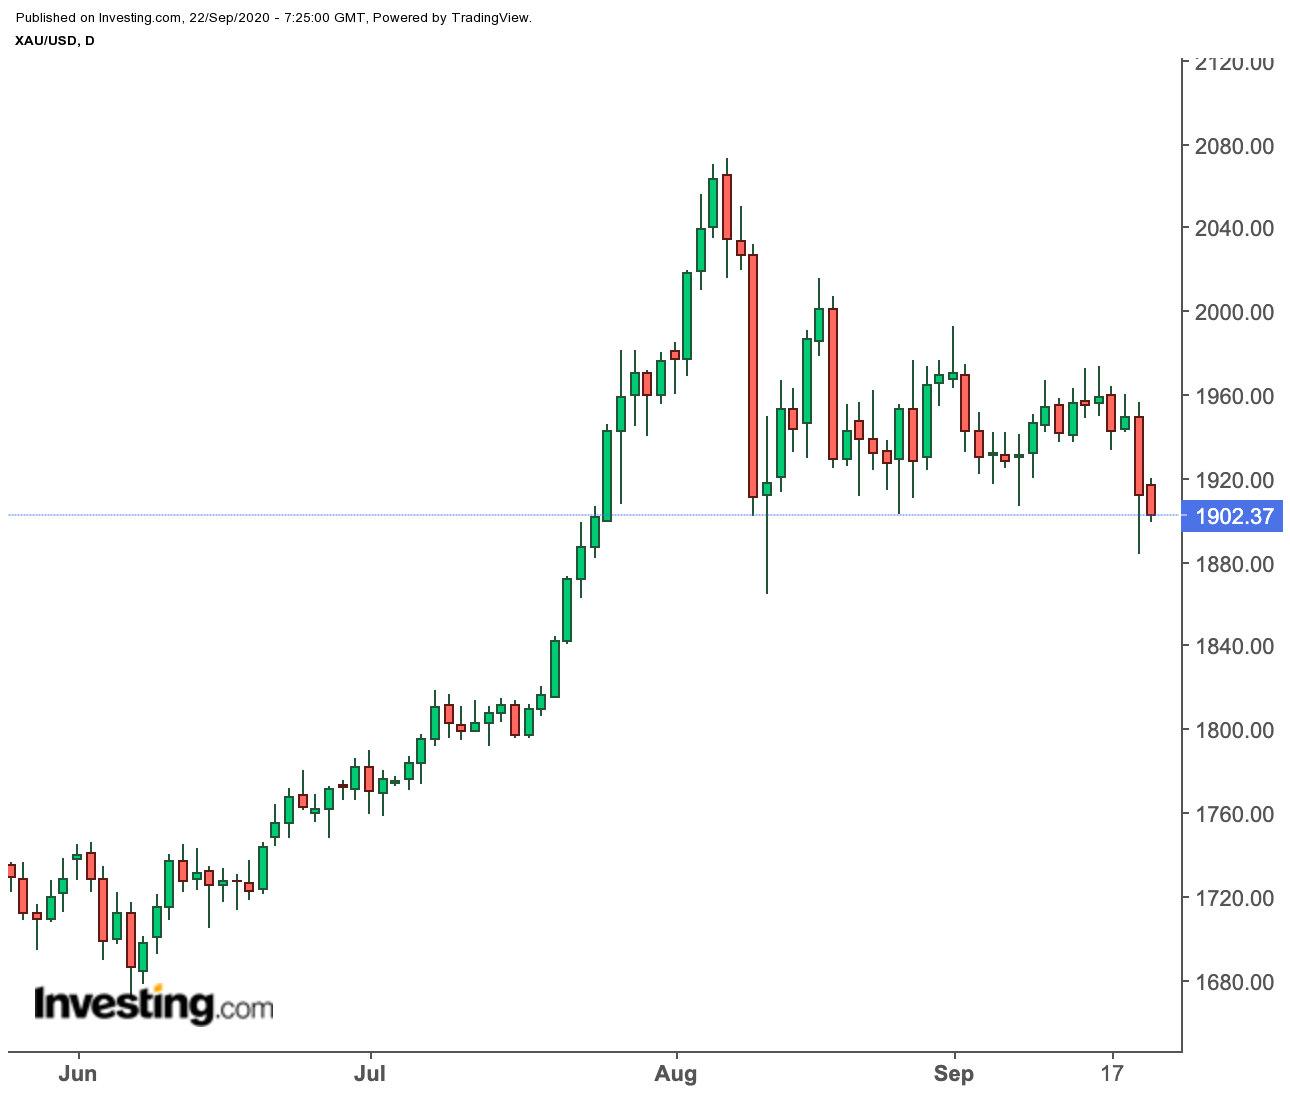
The spot price of gold, which tracks real-time trades in bullion, was, meanwhile, down $5.82, or 0.3%, at $1,906.38 per ounce. In the previous session, bullion hit a six-week low of $1,883.21.

Gold’s Range Wide At $1,900-$1,970
A range of $1,900-$1,970 would be good for gold now, with aspirations for $2,000 and above best left for later.
“A move above Friday’s high of $1,960 would be an indication of something moving, but for now, it is very difficult to get excited about gold,” Richard Perry of Hantec Markets said in another blog post on FX Street.
With its steadying from Monday’s plunge, gold may have settled immediate fears of a renewed downside momentum build-up, though its largely neutral-to-bearish tone will persist for now. Perry added:
“Daily momentum indicators are sitting very much around neutral levels, with Relative Strength Indicator and Stochastics flat but a shade above 50, whilst Moving Average Convergence/Divergence lines are flat but a shade above neutral.”
“We continue to take any support on gold above the 23.6% Fibonacci retracement (of $1451/$2072) at $1926 as being marginally positive for the gold outlook. However the bulls need to pull above $1,973 to really push towards the key near term resistance of $2,015. The hourly chart shows support holding above $1,937/$1,940 pivot band which sustains the mild positive bias, however, indicators appear neutralised still and the bulls unable to push forward.”
Sunil Kumar Dixit has a similar view. “If the metal fails around 1927-1935, the correction may extend lower to 100 Day SMA $1,863 and further next 38.2% Fibonacci level $1,836,” says the independent gold chartist.
Fed Chief’s Testimony Could Help Gold Or The Dollar
Gold could muster a way forward if Federal Reserve Chairman Jay Powell’s three-day testimony to Congress, which began on Tuesday, helps the yellow metal catch a bid.
In his opening remarks to Congress, released early to the media, Powell said US economic indicators such as employment, housing and fixed investments for business have improved markedly since the outbreak of the coronavirus pandemic in March.
But more work was needed to restore the nation to the pre-pandemic levels, he said, adding:
“We remain committed to using our tools to do what we can, for as long as it takes, to ensure that the recovery will be as strong as possible, and to limit lasting damage to the economy.”
A couple of months back, such a remark from Powell might have been enough to power gold into $2,000 highs.
Extended Wall Street Weakness Could Hurt Gold
But these days, it’s the dollar that’s likely to catch a bid—illogically as it may be given the yawning US fiscal deficit and its debasing effect on the greenback. Talk of deflation, as much as inflation, has also made investors wary of bulking up in gold.
Says Perry of Hantec Markets:
“With rising risk aversion standing out as a primary catalyst helping steer the US Dollar higher, the DXY Index could extend its advance alongside the S&P 500 VIX Index, or fear-gauge. If expected market volatility reverts back lower, however, so too could USD price action.”
Referring to the Sept. 16 meeting of the central bank's Federal Open Market Committee, he added:
“The latest advance set forth by broader US Dollar Index reinforces the 92.75-price level as an area of buoyancy, which was a key technical support level identified in last week’s FOMC preview.”
If Monday’s slide on Wall Street continues, then there might be little to hamper the dollar.
“The equity selloff gathered quite dramatic momentum during the European day and the risk-averse characteristics of the US dollar really came to the fore,” National Australia Bank head of FX Ray Attrill told Reuters.
Disclaimer: Barani Krishnan does not own or hold a position in the commodities or securities he writes about.
