ON Semiconductor dips after in-line Q4 revenue and 2026 outlook
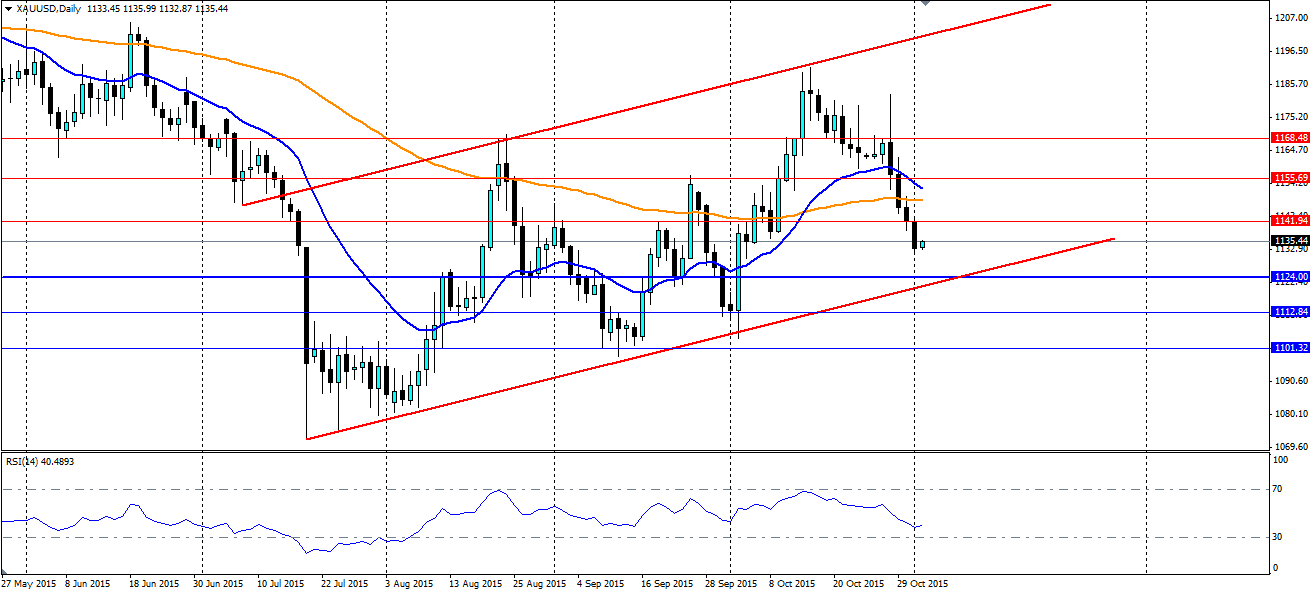
Gold has suffered at the hands of the Fed recently as they talk up the prospect of a rate rise at the December meeting. The slide could be halted as the precious metal looks for support along the trend line, coinciding with a level that has proved to be solid in the past.
Gold fell sharply last week as comments from the US Federal Reserve suggested that a rate hike for December was still on the cards. The Hawkish rhetoric from the Fed was a bit of a surprise to the markets, which had been expecting the usual meek dovishness. The Fed suggested the economy was on track and they would be “determining whether it is appropriate to raise the Federal Funds rate at the next meeting”. This was a vast turnaround from the usual wait and see approach.
This week will be a rather important one for gold and for the Fed itself. The biggest news event in the monthly economic calendar is the US Nonfarm Employment Change which is scheduled for Friday. The previous results have been poor to say the least with September falling well short of the expected 201k to come in at 142k. To make matters worse, August’s result of 173k was revised sharply downwards to just 136k.
The market is expecting 179k jobs to have been added in October when the result is released this week. Anything short, or any downgrades, will damage the chance of a rate rise in December, and will subsequently be bullish for gold. Until Friday, watch out for the ADP nonfarm result along with a testimony to congress by the Fed’s Chairwoman Janet Yellen. Several other FOMC members are due to speak this week which could add volatility to gold.

The support zone can be clearly seen on the above daily chart for gold. The $1124.00 an ounce level has been a point of interest for gold on several occasions, acting as a neckline as well as swing points. The bullish channel is also a dominating feature on the chart and one that traders will likely show respect for if the price shifts lower to test it.
The RSI oscillator has also been trending lower with the price, however it still has a little bit further to fall before it hits oversold. Look for plenty of orders to be stacked at the support at 1124.00, with the bulls ready to defend this level. If we break through, further support is located at 1112.84 and 1101.32. If 1124.00 holds and a leg higher forms, look for resistance at 1141.94, 1155.69 and 1168.48 with the 100 day MA likely to act as dynamic resistance.
