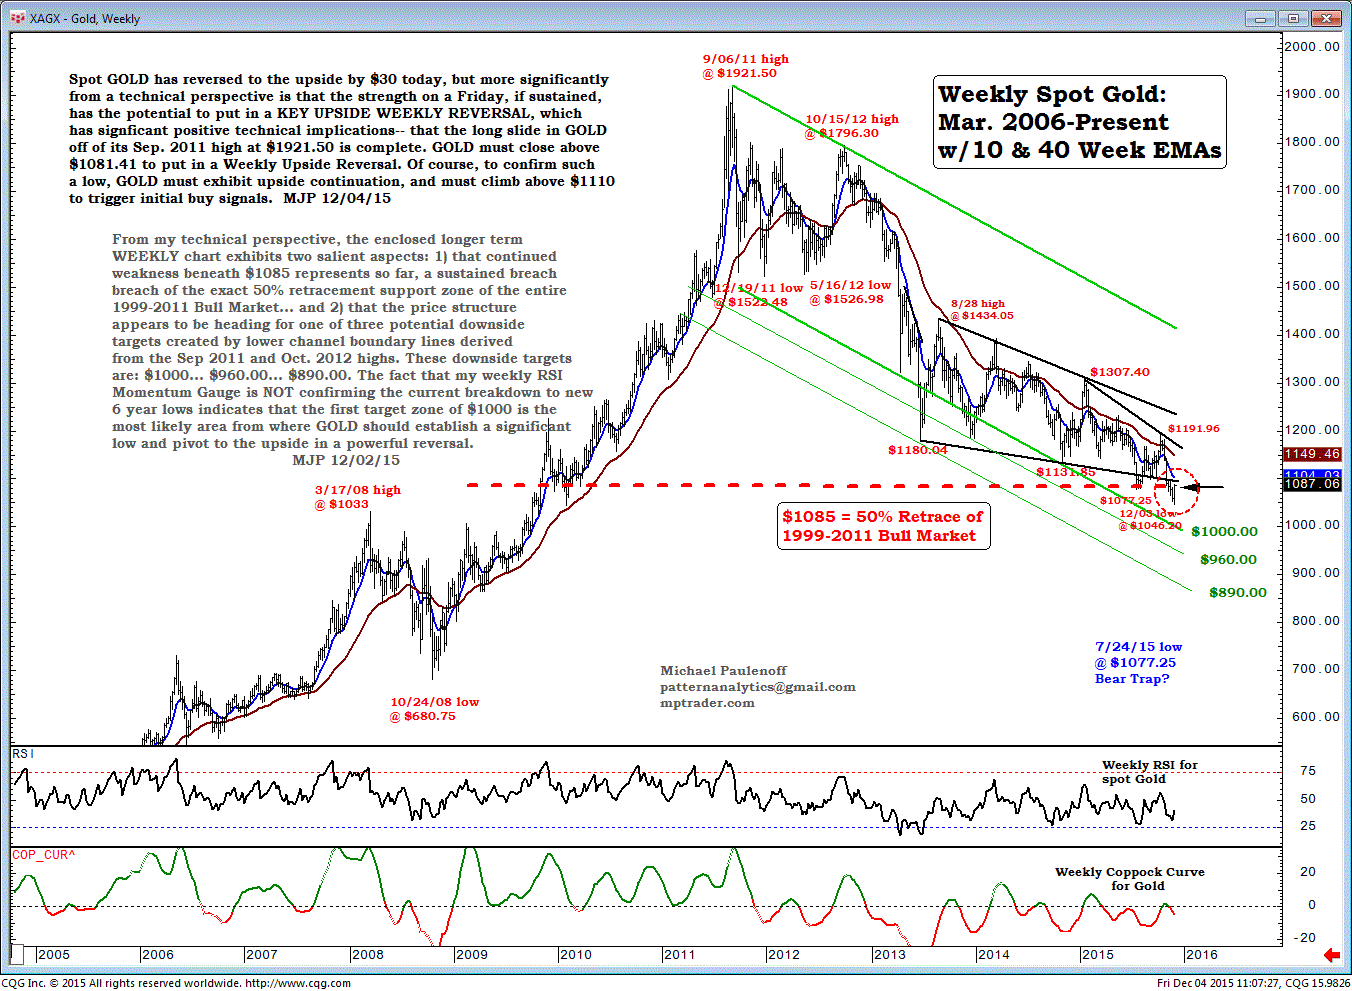
Spot Gold reversed to the upside by $30 on Friday, but more significantly from a technical perspective is that the strength on a Friday, if sustained, has the potential to put in a key, upside weekly reversal, which has significant positive technical implications—that the long slide in Gold, off of its September 2011 high at $1921.50, is complete.
Gold must close above $1081.41 to put in a weekly upside reversal.
Of course, to confirm such a low, Gold must exhibit upside continuation, and must climb above $1110 to trigger initial buy signals.
From my technical perspective, the enclosed longer-term, weekly chart exhibits two salient aspects:
1) that continued weakness beneath $1085 represents so far, a sustained breach of the exact 50% retracement-support zone of the entire 1999-2011 Bull Market... and
2) that the price structure appears to be heading for one of three potential downside targets created by lower-channel boundary lines derived from the Sept. 2011 and Oct. 2012 highs.
These downside targets are: $1000... $960.00... $890.00. The fact that my weekly RSI momentum gauge is not confirming the current breakdown to new 6 year lows indicates that the first target zone of $1000 is the most likely area from where Gold should establish a significant low and pivot to the upside in a powerful reversal. (MJP 12/02/15)

Which stock to consider in your next trade?
AI computing powers are changing the Canadian stock market. Investing.com’s ProPicks AI are winning stock portfolios chosen by our advanced AI for Canada, the US, and other exciting markets around the globe. Our top strategy, Tech Titans, nearly doubled the S&P 500 in 2024 - one of the most bullish years in history. And Beat the TSX, designed for broad market exposure, is showing +878% gains with 10 years’ back-tested performance. Which Canadian stock will be the next to soar?
Unlock ProPicks AI