- Bank of America (NYSE:BAC) predicts gold prices can reach $3000 in the next 18 months.
- As of now, the metal is already on the rise and approaching new records.
- We will explore 4 investment strategies (including ETFs and stocks) to capitalize on this golden opportunity.
- Unlock AI-powered Stock Picks for Under $8/Month: Summer Sale Starts Now!
Historically, gold tends to shine the brightest between November and February, but we're just in July and the yellow metal approaching new record highs already.
Despite China's pause on gold buying, Bank of America remains bullish, projecting gold to reach $3,000 within the next 12-18 months.

Several catalysts that have fueled the metal's rise so far are still in place and continue to aid the bullish sentiment. Some of them are:
- Interest Rate Tailwinds: Investors are expecting a rate cut by September and beyond.
- Geopolitical Turmoil: Ongoing conflicts in Ukraine and the Middle East continue to inject uncertainty into the market, driving investors towards safe havens like gold.
- Central Bank Diversification: Central banks are strategically adding gold to their reserves, reducing reliance on the dollar. While China's recent buying streak paused, a World Gold Council report suggests 20 central banks still plan to increase gold holdings.
- Rising Demand: Meanwhile, gold consumers in India and China show no signs of slowing down. India's reserves are at a two-year high, and China's real estate downturn is sparking increased demand.
While buying physical gold always remains an option, there are other ways to capitalize on the bull run.
Below, we explore four ways to make the most of the yellow metal's rally through stocks and ETFs.
Stocks to Consider:
1. Agnico Eagle Mines (TSX:AEM) Limited
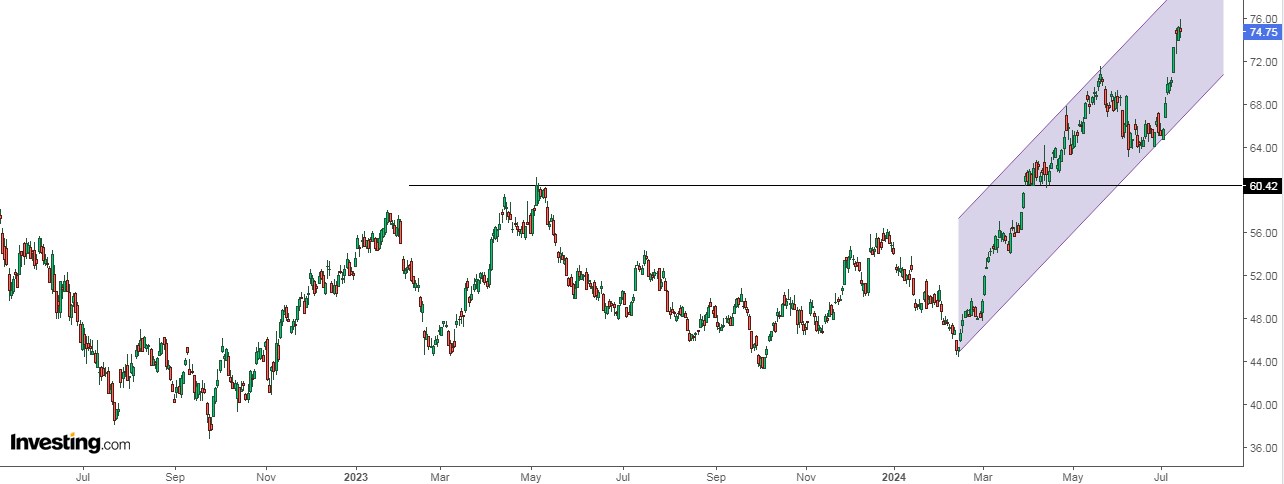
On May 9, Agnico Eagle Mines Limited (NYSE:AEM) opened at $66.67. I noted its potential to reach $73.18, and it has surpassed that, currently trading near $75.95.

It is the third-largest gold producer in the world and has increased its reserve base for three consecutive years. Most of its production is in Canada, but it also has operations in Finland, Australia, and Mexico.
It has maintained dividend payments for 32 consecutive years, with a dividend yield of 2.14%.
The company posted solid first-quarter results with revenues of over $1.8 billion and gold production of around 880,000 ounces. The gross profit margin of 56.32% underscores its efficiency in managing costs relative to revenues.
It reports results on July 31 and is expected to report EPS up 79.76% and revenue up 22.25%.
It also received a credit rating upgrade to BAA1 from Moody's, reflecting improved financial strength.
The market's average price target would be $78.35.
2. Wheaton Precious Metals (TSX:WPM)
On May 9, Wheaton Precious Metals (NYSE:WPM) was trading at $54.82. That day, I noted its potential to reach $59.10. It met that target and has since risen to $60.03.

Formerly called Silver Wheaton, it changed its name to its current one on May 10, 2017. It was established in 2004 and is based in Canada, being a precious metals company engaged in the sale of gold and other precious metals.
The company maintains dividend payments for 14 consecutive years and has a dividend yield of 1.05%.
First quarter results showed significant operating cash flow of $220 million and net earnings in excess of $160 million. This solid performance underscores the company's operating efficiency.
It will present its quarterly accounts on August 7.
The average market price target would be at $65.69.
ETFs to Buy to Make the Most of a Potential Gold Rally:
1. VanEck Gold Miners ETF
Launched on May 15, 2006, VanEck Gold Miners ETF (NYSE:GDX) seeks to replicate the NYSE Arca Gold Miners which is comprised of gold mining companies.

The net annual expense ratio is 0.51%. The fund also offers a dividend yield of 1.38% and annual payouts have ranged from $0.48 to $0.53 per share since 2021.
It is a very liquid ETF with a 30-day average daily trading volume exceeding 20 million shares.
Over the last 5 years its return is 7.19% and over the last year 15.30%. It invests in 54 companies and the top 10 account for 60%. Its top holdings are:
- Newmont Goldcorp (NYSE:NEM)
- Agnico Eagle Mines
- Barrick Gold (NYSE:GOLD)
- Wheaton Precious Metals
- Franco-Nevada Corporation (NYSE:FNV)
2. IShares MSCI Global Gold Miners ETF
Created on January 312, 2012, iShares MSCI Global Gold Miners ETF (NASDAQ:RING) is comprised of gold-related companies.

It manages $508.9 million in assets and has annual net expenses of 0.39%, making it one of the cheapest ETFs in its sector.
The fund pays shareholders $0.19 in dividends semi-annually with a yield of 1.26%.
It has an average daily volume of 107,525 shares over the last 20 trading days.
The top 3 holdings account for over 45% of the ETF and the top 10 holdings account for 73.34% of its assets. Among its top stocks we have:
- Newmont
- Agnico Eagle Mines
- Barrick Gold
- Kinross Gold Corp (NYSE:KGC)
***
This summer, get exclusive discounts on our subscriptions, including annual plans for less than $8 a month!
Are you tired of watching the big players rake in profits while you're left on the sidelines?
InvestingPro's revolutionary AI tool, ProPicks, puts the power of Wall Street's secret weapon - AI-powered stock selection - at YOUR fingertips!
Don't miss this limited-time offer.
Subscribe to InvestingPro today and take your investing game to the next level!
Disclaimer: This article is written for informational purposes only; it does not constitute a solicitation, offer, advice, counsel or recommendation to invest as such it is not intended to incentivize the purchase of assets in any way. I would like to remind you that any type of asset, is evaluated from multiple perspectives and is highly risky and therefore, any investment decision and the associated risk remains with the investor.

