Since early February I have visually described my position and mental framework in the precious metals market as being “Cool as a Cucumber”. This has served me well as it has allowed me to stay invested as the move powered higher and many bailed to the sidelines expecting an early correction.
Well now that we are into the first significant pullback, let's see how Mr. Cucumber is doing and some of the market factors he is considering. Is he keeping his cool?
Market Psychology
I am still of the view that the gold price doesn’t go much further down from here. Maybe down to 1180 gold or 180 HUI. But before that, I first think we are due for a bounce. I just don’t see Mr. Market accommodating all of these sold out bulls by giving them their gentleman’s entry down where they wished they had bought at yesterday’s prices.
Sorry, they snoozed they lose. The rule of corrections is they come when nobody wants them. I would say the majority have been rooting for this one for 2-3 months. Also, corrections come when they are least expected and the majority have become convinced that price cannot recede and is actually at the cusp of an advance. Clearly this has not been the case.
So with this reality, I would say that if we do violate these levels and enter into a deep correction. It is the market's way of saying it's not actually a correction, but in fact a resumption of the bear. So we watch and wait. Be patient and objective.
Step Sum and Open Interest
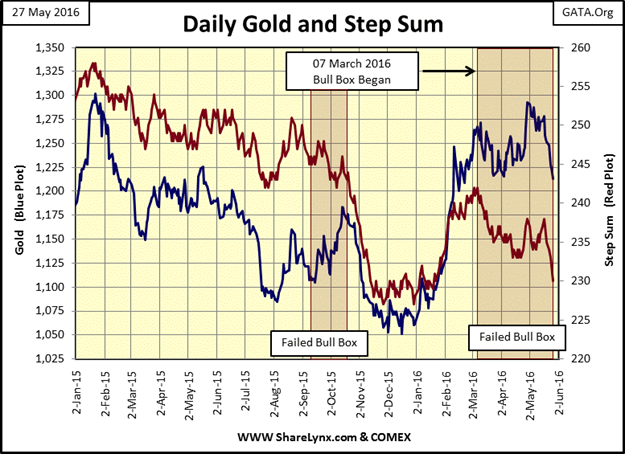
I refer to my colleague Mark Lundeen and his groundbreaking work on the step sum indicator, a running total of up vs down days. Gold has gone down the last 9 days in a row and 15 of the last 21 days. This is extraordinary compression and likely to relieve itself on the upside very soon.
There is good and bad news in this observation. Note the chart below. We can see the step sum hammering down, yet so far it has failed to drive gold to a new consolidation low. This indicates support, especially when you compare it to previous times.
Note too last fall, where the step just cratered and hammered the gold price. The bad part is that the step sum has violated its previous low, so it's a mixed view. But it is pointing toward a relief rally in the down trend.
Open Interest
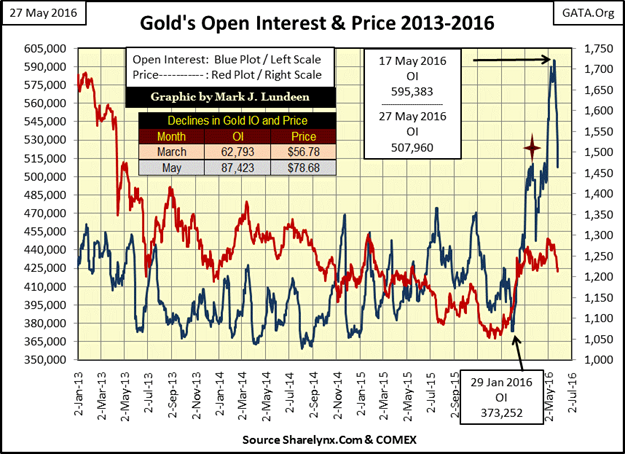
Open interest can be seen to have an effect on the gold price. One can choose to view the level of OI from the eyes of manipulation or just the market's action. Either way, the result is the same.
Below we see how OI was ramped (you choose the reason) and driven down two times in April and May. It was a massive hammer blow. The manipulators would claim it was an attempt to knock down the price. If you don’t want to believe it, that’s OK. The effect is the same.
The important point is this pile driver didn’t have the same effect as past occurrences. It didn’t crush gold, it just stopped its advance.
Compare current action with the previous case when an equal amount of OI declined back in April and June 2013. Gold got obliterated then, whereas today it held on. This is a game changer. It says things are different now, we are in a different world…bullish.
USD effect on gold- A new era of transition (neutral)
We all know how the gold bulls quake in their boots when they see the USD show strength. I see this as a market dynamic in its waning days.
Here is what’s changing: the USD is the world’s reserve currency, yet gold is a currency too and it has been for around 5,000 years. However, gold’s been in the back seat relative to the USD for about 45 years now. That’s now in a transition. Gold is in the process of usurping and overtaking the USD as the world’s premiere currency.
And that’s what I believe we see expressed in the chart below. We apply standard Weinstein methodology, analyzing its progress.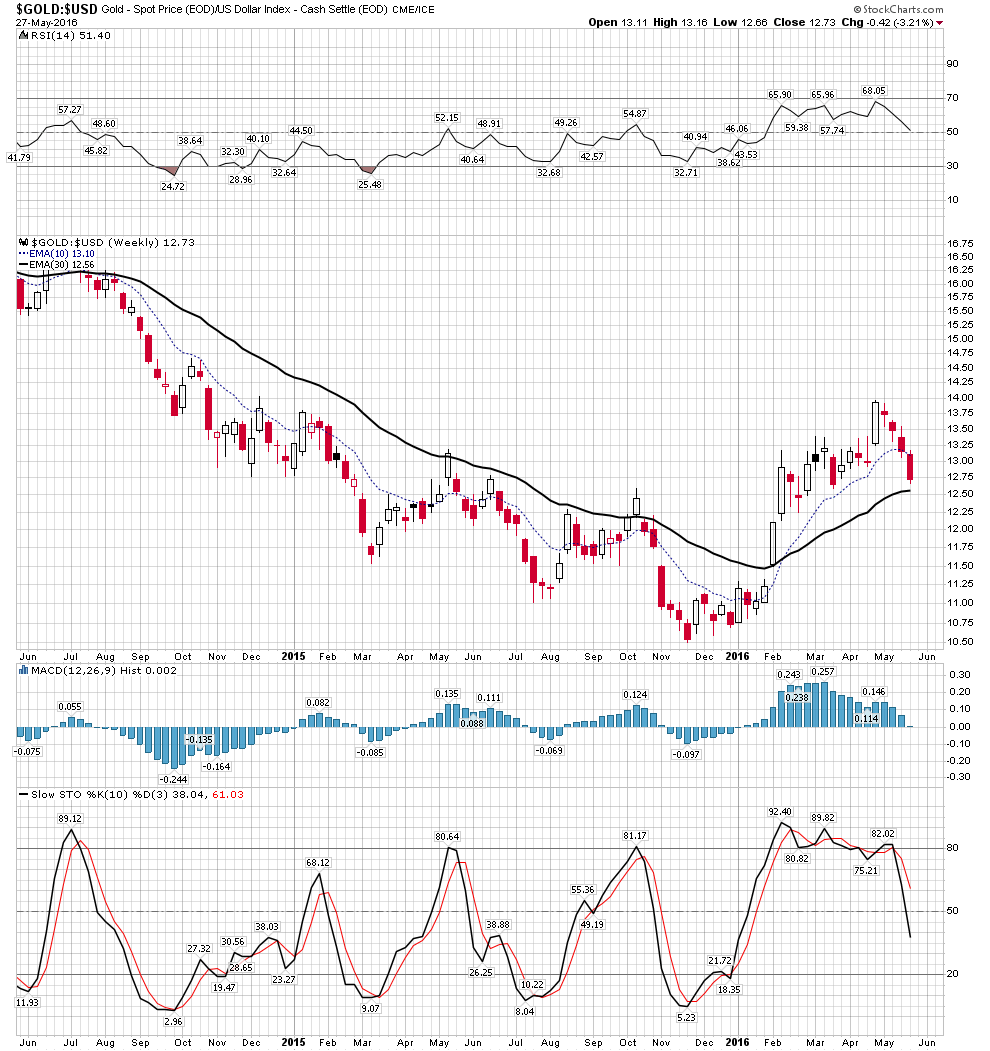
Late last year, we can see gold making the turn vs the USD. We are now in an upward configuration. We know how these transition bottoms develop.
First we see the end of the stage 4 decline and an entry into a stage 1 bottom. We don’t know for sure if the rise above the 30 EMA is the entry into stage 2 yet, as we don’t know if it is going to stick. If the Gold/USD ratio drops below the 30 EMA, it’s not in stage 2 yet and is likely still putting in a stage 1 bottom. Again, we patiently watch and wait, but you have to see that once we enter into a stage 2 uptrend, this is a huge bull market game changer.
Bearish Case-Commodities
Recent PM charts have been bearish and there have been a collection of super bearish claims about the collapse in the gold price to sub-$1,000. I am not saying that a decline can’t happen, but a few concurrent things must also happen if gold is to tank to these levels.
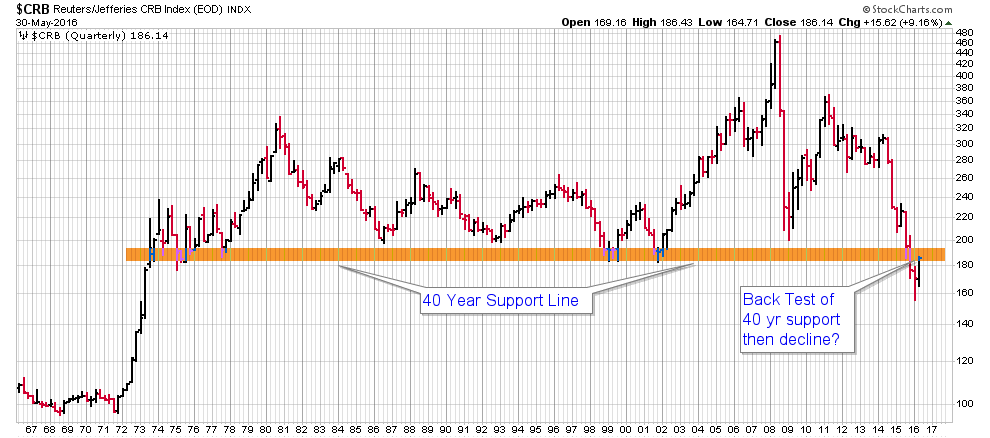
Specifically, commodities and electrical consumption must decline precipitously if gold is going significantly lower to these levels. So let’s look at the long term commodity picture (via the CRB Index, below) and ask the question, "Has the recent strength in commodities just been a back-test to the longer term downtrend?". If it is just a back-test of the 40 year support level, which it has already violated, then it is saying commodities are now set to resume their fall.
The implications of such a fall are devastating for the entire world. Better run to your cave with your guns and beans…It could get that ugly.
Electrical Consumption BEV chart
Another chart from Mark shows electrical consumption, via his BEV format. This is a pretty disconcerting chart, as it reveals the lies told to us by government statisticians.
Things are NOT getting better…surprise! Note how we just violated the last low of Aug 2013. This is saying recession is now here and adds validation to the commodity downtrend we saw above. This is a big deal because it's a truth teller. Not subject to the BLS “adjustments” that skew the data and enable the lies which are regularly reported to us.
If we were to enter into a deflationary collapse which would drive gold lower, we would see this chart continue lower. Indeed, so far that’s what it is doing.
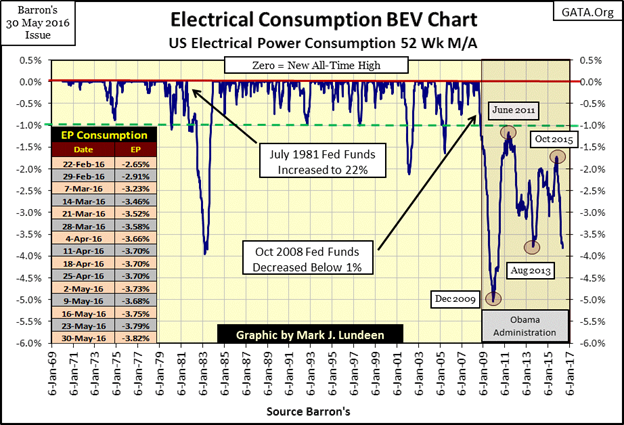
So this is what would have to happen in order for gold to go to those doomsday targets of deep sub-1000. We would need to see both of these charts continue lower. I think there is a fair likelihood of this occurring with a worldwide deflationary impulse.
But wait. Even if this did occur, I don’t think Sub-1000 gold has any chance of happening.
Why? Because the Fed would likely start buying gold onto their balance sheet in a desperate attempt to stop the deflationary spiral. They have already started to discuss this. This is, by the way, eventually going to happen anyway when all of the conventional credit instruments fail and the world is in desperate need of collateral, but that’s a subject for a future essay.
Recall we have already witnessed the first round of “first responders” buying gold due to financial stress. This group was made up of Druckenmiller, Soros, Icahn and others. These are the leading edge. If gold dropped to 1000, I feel confident a larger contingent of second tier responders would make the move and stop the fall.
Bottom line, I no longer see gold having any chance of going sub-$1,000, no matter how deflationary the backdrop becomes.
Cucumber Strategy
So how is Mr. Pickle doing? Well, he is still cool, but starting to wipe the beads of sweat off his brow. Luckily, he got in very early so he is still well into the money. He's is not squirming, but he is taking notice.
If we get a bounce, he will be slightly reducing some of his more liquid shares. He won’t be selling the junior producers that are at or near production, as input costs will continue to favor a positive flow to their bottom line as time progresses.
His view is, we will not resume the rally right away. Price has been too damaged now and it needs to rebuild a base. But he doesn’t expect it to be dropping to the level to accommodate the sold out bulls. So, as a strategy, we always stay off margin. We keep 20-25% cash and we look for targets of opportunity and patiently study our charts.
For me personally, I am approaching this bull market more from the long term buy-and-hold vs trade perspective. I want to follow the great ones. The Ross Beatys, Mark Creasys, Robert Friedlands and others. So I am skewing more toward the corporate building strategy.
I don’t need to trade in and out of this stuff. I also directed a chunk of funds towards an exploration partnership two years ago where someone else does the management. It helps me stay cool as a cucumber.

