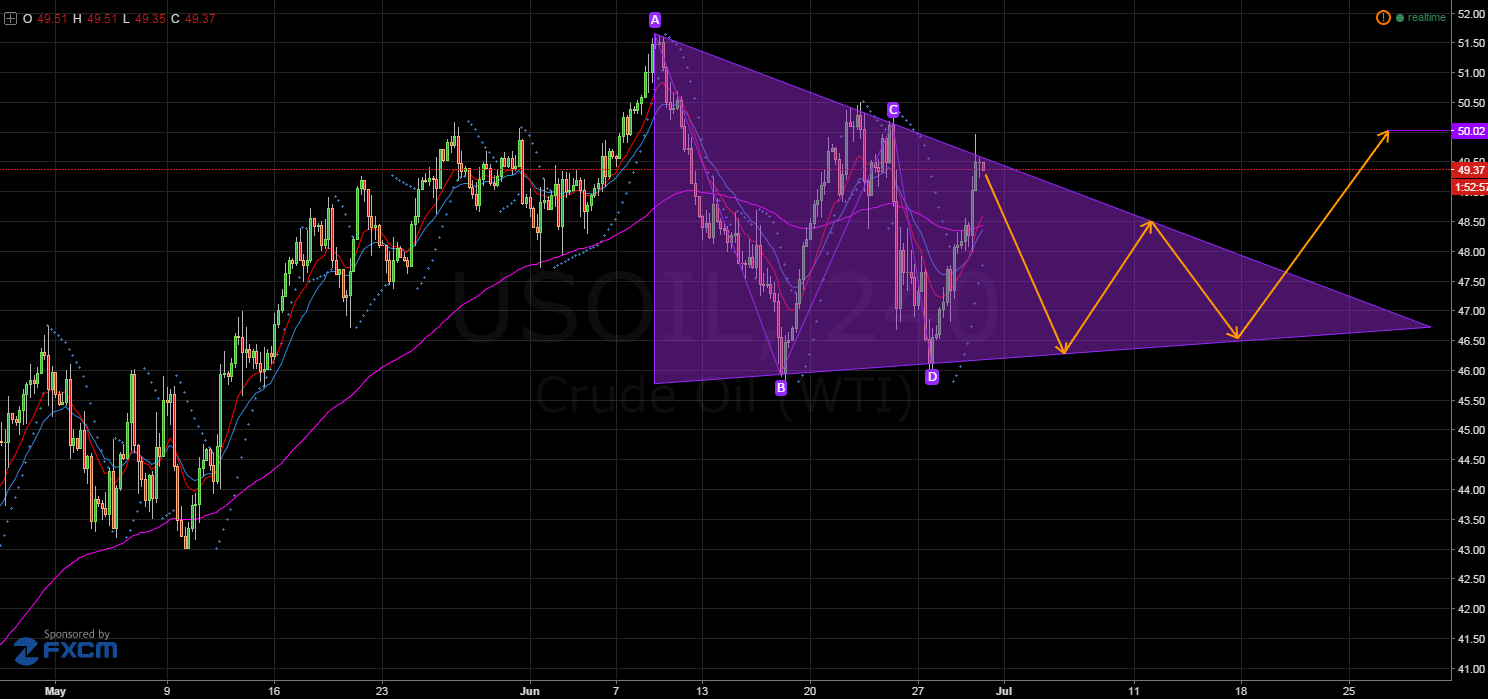
After nearing the pivotal $50 mark, oil prices could be about to take another hit despite the recent dip in US Crude Oil Inventories. Whilst the draw was largely responsible for the commodity’s surge higher, technicals are now turning against oil and hinting that it should move to the downside yet again. Specifically, keep an eye on the developing bullish pennant as it could see some volatile price movements in the coming weeks.
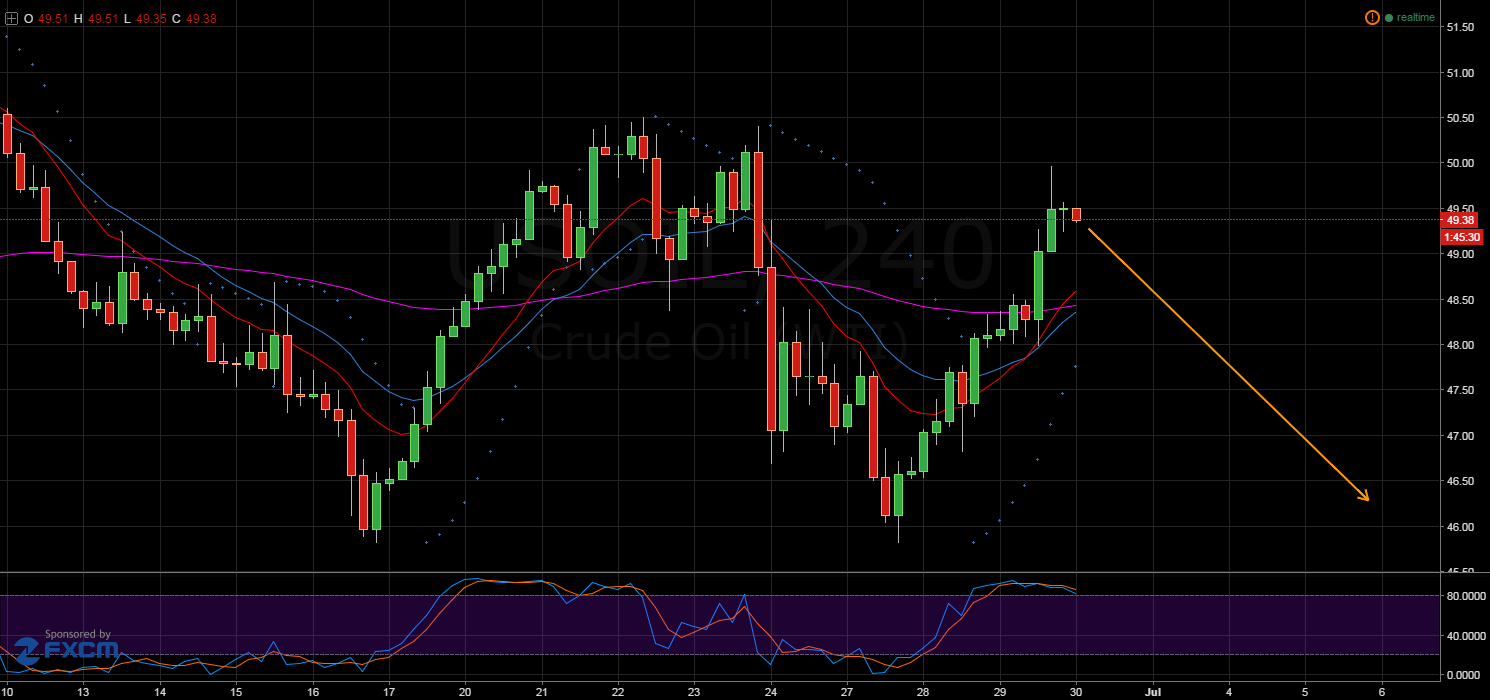
Firstly, as shown on the H4 chart below, a bullish pennant is becoming apparent which could send oil lower in the medium term. The commodity is highly likely to reverse in the coming sessions as the predicted point of inflection sits just below the 50.00 zone of resistance. Here, resistance is incredibly robust and, as of late at least, it has required extraordinary circumstances such as the OPEC Doha meeting to push oil past the 50.00 mark.

However, it remains worth mentioning that EMA activity on both the H4 and daily charts is still bullish. Consequently, the commodity may extend its gains slightly, prior to making the move back to the lower constraint of the pennant. This being said, the Parabolic SAR reading on the daily chart is presently bearish which could limit the extent to which oil can remain bullish.

Additionally, stochastics are currently signalling that a tumble is warranted sooner rather than later. As shown on the H4 chart, the stochastic oscillator is highly overbought and this should cap buying pressure significantly. Furthermore, whilst not currently overbought, the daily stochastics are nearing overbought territory and this will be giving oil bulls pause for thought.
Supporting these technical readings is the formation of a potential evening star candle pattern which hints at the likely scenario of a tumble. If the candle does form, oil should begin its retracement but it will need to break through the 23.6% Fibonacci support level at 49.00 before the downtrend is confirmed. After breaking support, the commodity should descend to around the 46.25 mark.
Ultimately, it remains highly unlikely that oil can continue to challenge the 50.00 mark for long, before the bears gain control again. Sentiment generated from the drop in US Crude Oil Inventories appears to have already run dry and the technicals are beginning to turn bearish. With the notable exception of EMA activity, a number of technical indicators are in agreement that the commodity is poised to reverse in the next few sessions. As a result, watch for any breakouts on the downside as the week comes to a close.
