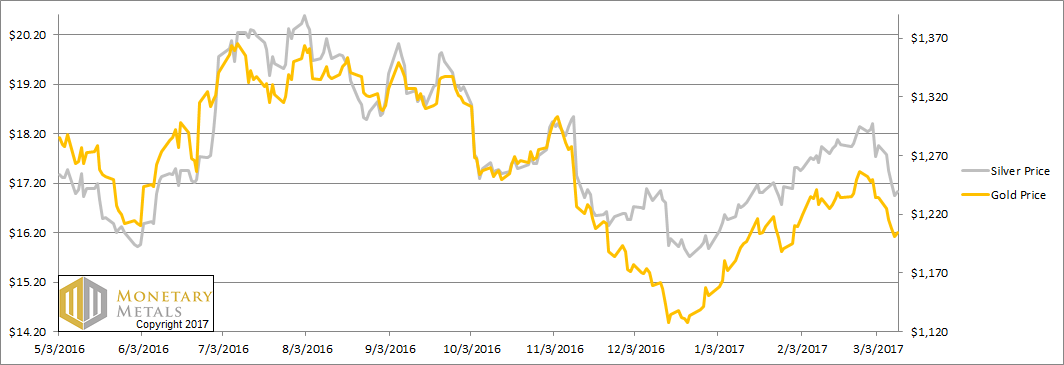
The question on the lips of everyone who plans to exchange his metal for dollars—widely thought to be money—is why did silver go down? The price of silver in dollar terms dropped from about 18 bucks to about 17, or about 5 percent.
The facile answer is manipulation. With no need of evidence—indeed with no evidence—one can assert this and not be questioned in the gold and silver communities. We have recently come across a term normally used to describe Leftists and Social Justice Warriors, virtue signaling. One piously declares that one supports the cause, one speaks truth to power, one sticks it to The Man, well you get the idea. The concept of virtue signaling seems equally appropriate to those who sing the chorus on every price drop, “manipulation.”
Besides, we have peeps in high places in London and New York and Beijing, and they tell us silver is manipulated…
Actually, we rather prefer to look at data than listen to whispers. What would the data show if demand for physical silver metal was robust and rising while someone sold so many futures contracts that the price of the metal was forced down just about a dollar?
The basis and cobasis are spreads between physical silver metal and futures. The scenario we just described would collapse the basis and skyrocket the cobasis.
Is that what happened this past week?
Before we get that, we want to note that crude oil fell from $53.33 last week to $48.49, or -9%. Copper fell from $2.70 to $2.60, or -3.7%. Wheat fell from $4.53 to $4.40, or -2.9%. People miscall this deflation.
We don’t know whether this will affect the Fed’s seeming commitment to damn the economy, full rate hikes ahead. However, we do know that sentiment bleeds from one speculative asset to another (and in a near-zero interest rate environment, all assets are used by speculators). “If energy, industrial metal, and food are going down, then surely silver should go down too,” seems to be the logic.
At least this past week.
We are much more interested in the supply and demand fundamentals. We acknowledge that speculators can temporarily move prices—sometimes a lot—but we firmly insist that eventually the market price reverts to the level called for by supply and demand.
So what happened to those fundamentals? Below, we will show the only true picture of the gold and silver supply and demand. But first, the price and ratio charts.
The Prices of Gold and Silver
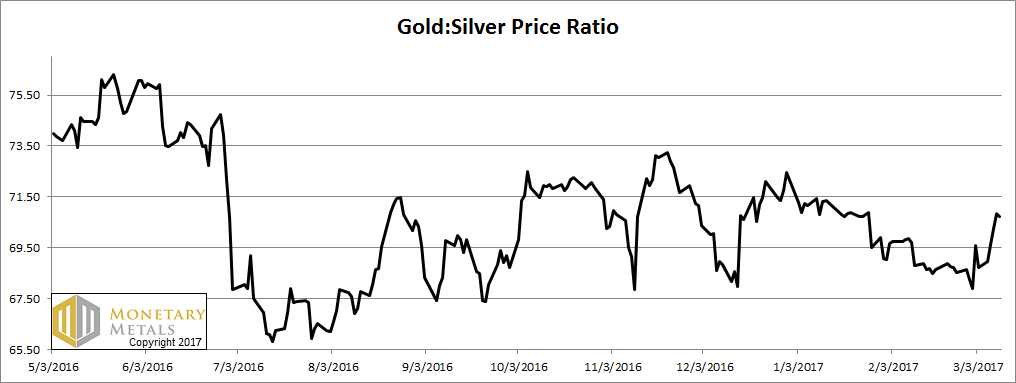
Next, this is a graph of the gold price measured in silver, otherwise known as the gold-to-silver ratio. It moved up sharply last week. If we were chartists, we might note that the ratio seems to be making a series of higher lows since mid-July.
The Ratio of the Gold Price to the Silver Price
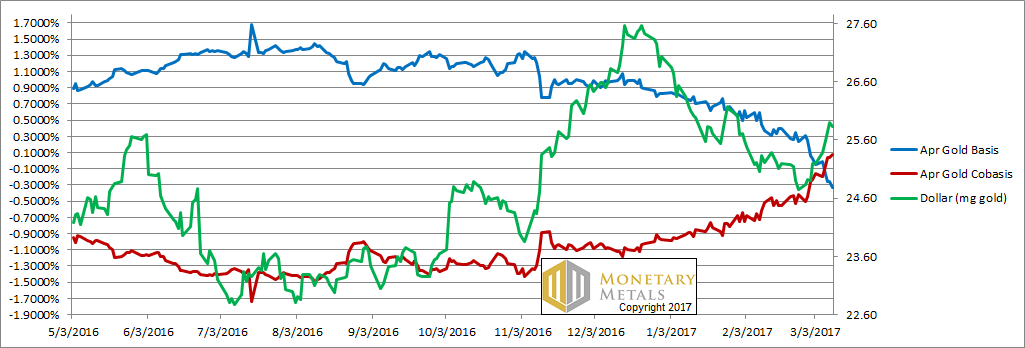
For each metal, we will look at a graph of the basis and cobasis overlaid with the price of the dollar in terms of the respective metal. It will make it easier to provide brief commentary. The dollar will be represented in green, the basis in blue and cobasis in red.
Here is the gold graph:
The Gold Basis and Cobasis and the Dollar Price
As the price of the dollar rose through the week, so did the cobasis. The price of the dollar is the inverse of the price of gold in dollar terms, and allows us to see a clearer picture. It is not gold going anywhere, but the dollar going up and down. The cobasis is our indicator of scarcity.
While the dollar went up 0.5mg gold, the cobasis went up 24bps. This is the old pattern, rising gold scarcity as the dollar rises. The same happened in farther contracts, to a smaller degree.
While the market price of gold fell $24, our calculated fundamental price went down only $15. It’s more than $150 over the market price.
Now let’s look at silver:
The Silver Basis and Cobasis and the Dollar Price
The cobasis in silver actually fell. It didn’t fall a lot, but this drop came in a week when the price fell substantially. This puts the lie to the allegation of manipulation. Selling of futures would push the cobasis up.
Silver fell because owners of the metal decided to sell and/or buyers of physical metal slowed their purchases. We can debate why they did that, but not the meaning of the data.
Note also the much lower absolute level of the silver cobasis. Silver is -86bps compared to gold at +8bps (a slight temporary backwardation).
The silver fundamental price also fell, about half as much as the market price. It is now $1.03 over market.
This means that, while those who need to unload their silver are unhappy, those planning to load up can now exchange the same quantity of Federal Reserve notes for more silver than last week. With (slightly) better fundamentals too, as last week the fundamental was only $0.87 over market.
The only question on that front is the trend. For two weeks, the fundamental has become weaker.
