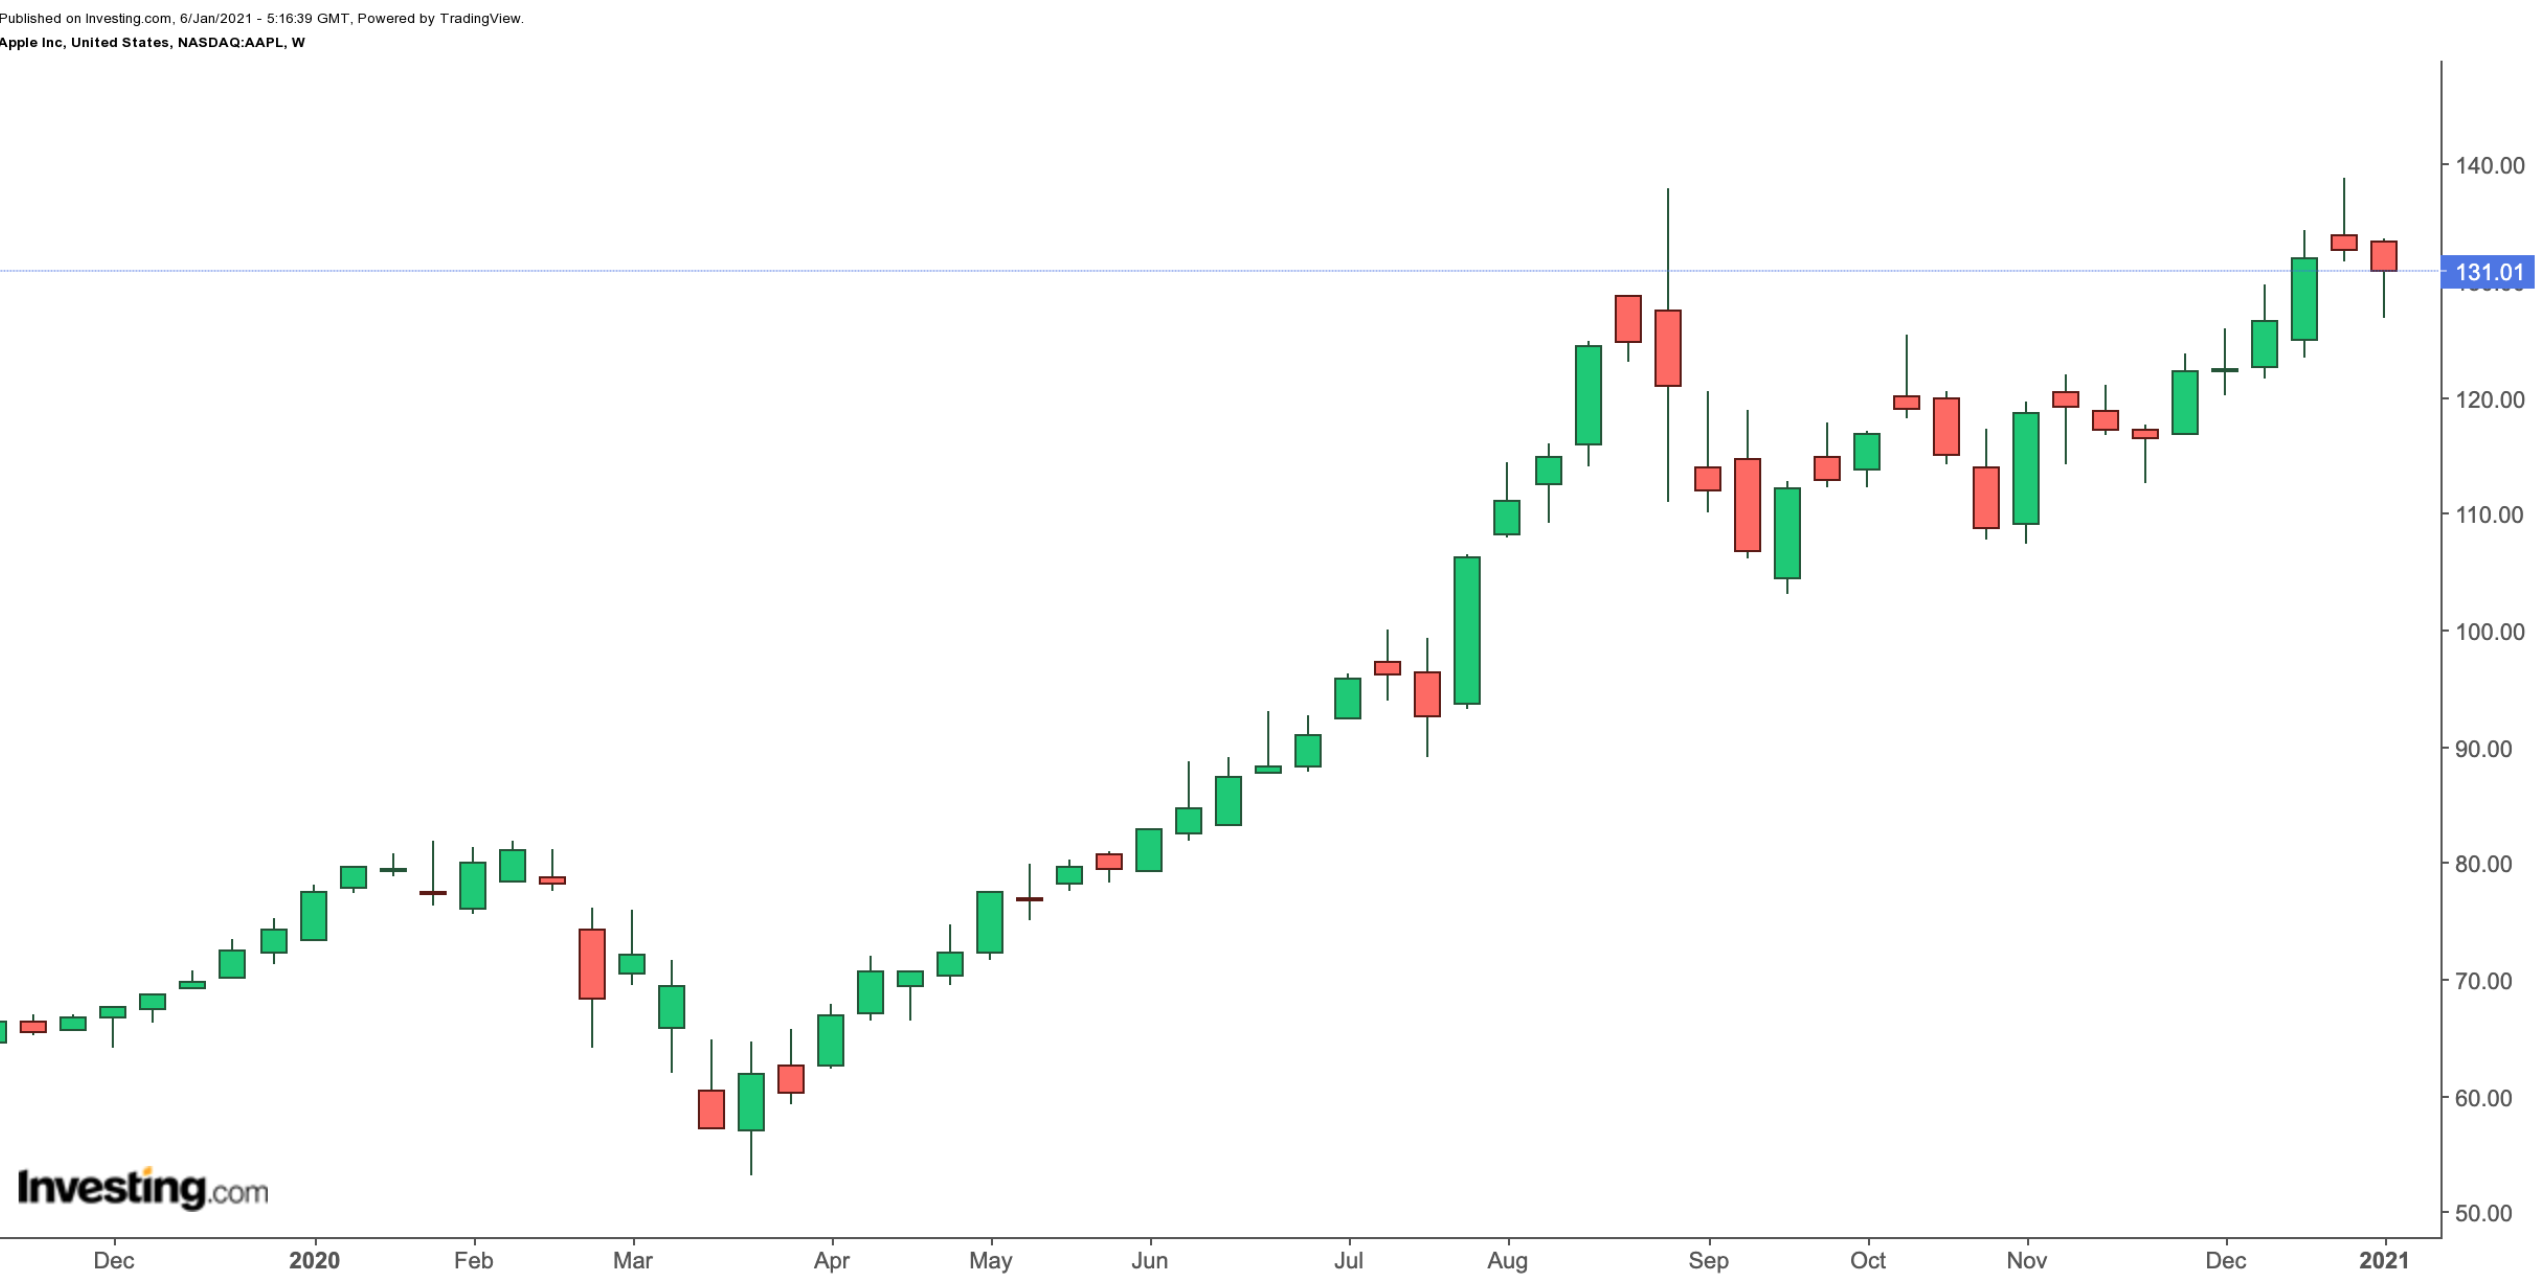
Apple (NASDAQ:AAPL) has been one of the most-followed names in the past several months as markets moved steadily higher. Shares of the California-based consumer electronics giant hit a record high of $138.79 on Dec. 29.

APPL stock is up more than 70% in the past year, so $1,000 invested in January 2020 would now be worth over $1,700. However, on a short-term basis, the stock tends to be volatile. Its beta (β), which shows how volatile Apple stock is compared to the broader market, is close to 1.3.
A stock with a beta greater than 1 is more volatile than the overall market. If a stock’s beta is less than 1, then it is considered less volatile than the market. For example, utility stocks usually have betas lower than 1, whereas most tech stocks have betas higher than 1.
Thus, Apple’s share price is likely to be more volatile than the S&P 500, which has a beta that is typically expressed as 1. If profit-taking were to hit the broader market in the near future, we can possibly expect AAPL stock to come under significant pressure too.
Investors who want to participate in the potential returns that Apple shares could offer in 2021 may consider buying an exchange-traded fund (ETF) that includes AAPL stock. This way, they could possibly avoid some of the stomach-churning short-term moves.
There are currently around 300 ETFs that include Apple among their holdings. Here's a look at two.
1. iShares Russell Top 200 Growth ETF
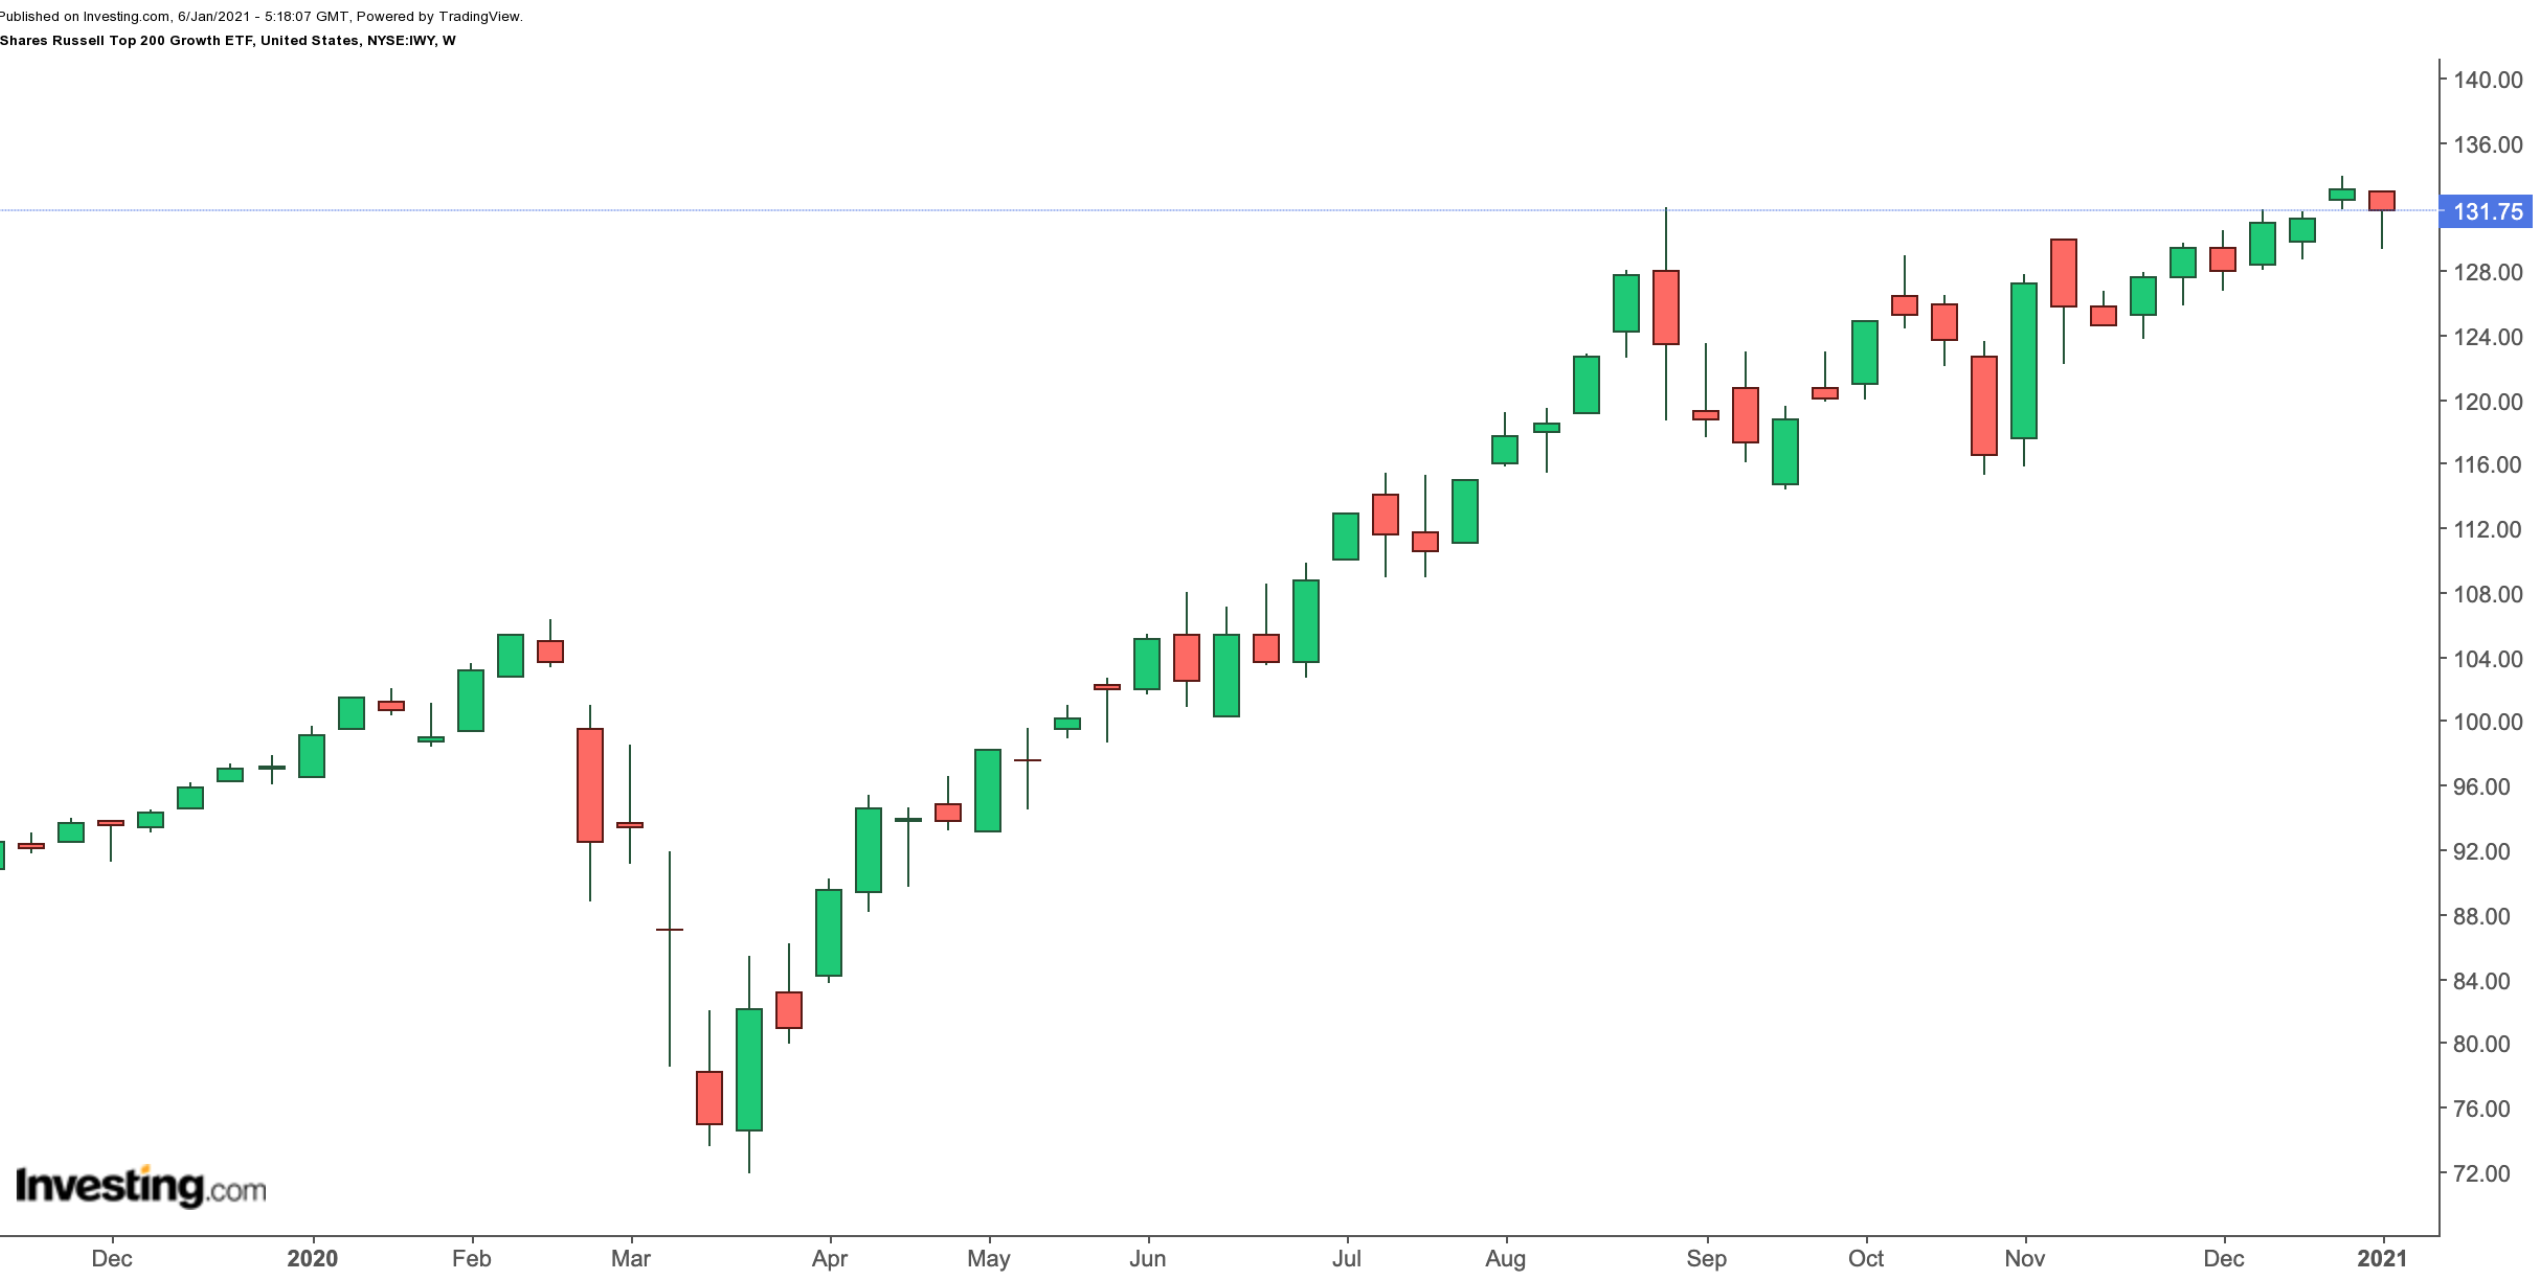
Current Price: $131.75
52-Week Range: $71.86 - $133.83
Dividend Yield: 0.71%
Expense Ratio: 0.20%
The iShares Russell Top 200 Growth ETF (NYSE:IWY) provides exposure to large-capitalization US businesses expected to grow more than the market. In other words, the fund brings together earnings potential with the relative dependability of large-cap shares.

Over the long-run, the Street regards large-cap companies as more "secure," which means that despite occasional weakness, their stock prices do not get held down for too long.
Growth and value are the two main approaches to investing. In 2020, growth shares, for the most part, saw higher returns. However, since early November 2020, investors in value stocks have also seen their portfolios grow significantly.
IWY, which has 106 holdings, tracks the Russell Top 200 Growth Index. Since its inception in September 2009, its net assets have grown close to $3.5 billion.
In terms of sector allocation, about half of firms are in information technology (IT), followed by consumer discretionary (18.25%), communication: (11.95%) and health care (11.62%).
Apple, Microsoft (NASDAQ:MSFT), Amazon (NASDAQ:AMZN), Facebook (NASDAQ:FB), Tesla (NASDAQ:TSLA) and Alphabet (NASDAQ:GOOG) (NASDAQ:GOOGL) lead the names in the fund. Close to 55% of the assets are in the top 10 stocks.
Over the past year, IWY has increased by 34%. Trailing P/E and P/B ratios of 41.37 and 13.17, respectively, suggest an overstretched valuation at this point. The upcoming earnings season, which kicks off in less than two weeks could put pressure on a number of the holdings. A potential decline toward $125 or even below would improve the margin of safety.
Predicting whether value or growth stocks will do better in 2021 is not easy. We'd suggest a blend of both styles for most retail investors.
2. Fidelity MSCI Information Technology Index ETF
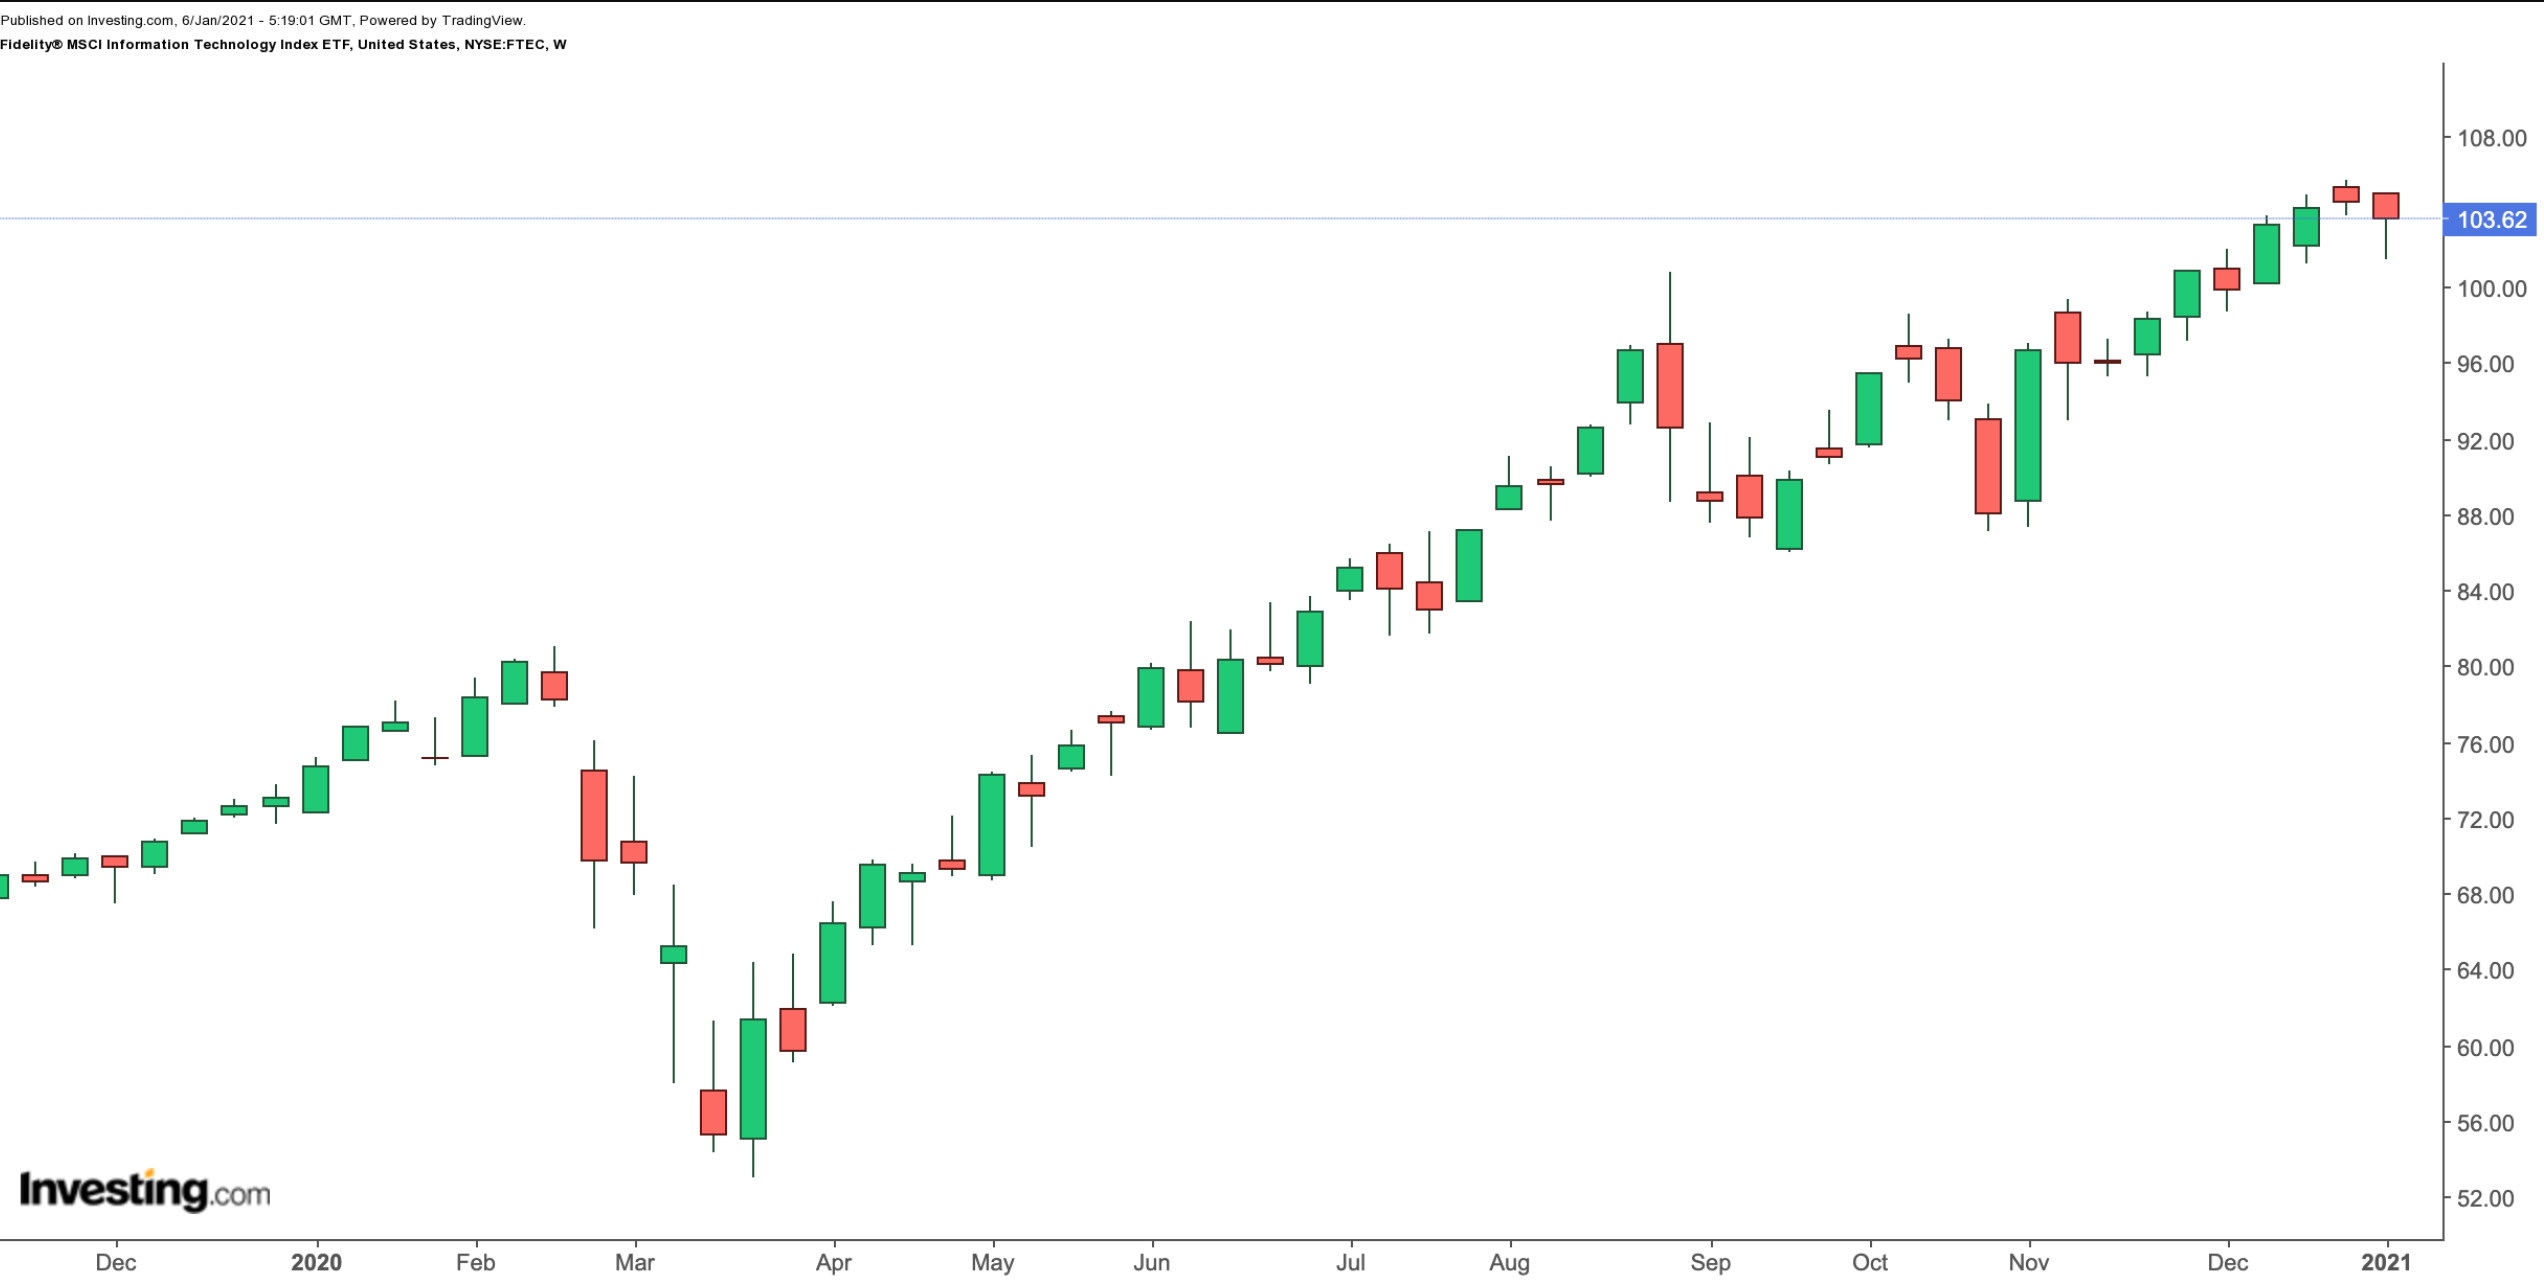
Current Price: $103.62
52-Week Range: $53.00 - $105.63
Dividend Yield: 0.83%
Expense Ratio: %0.08
Our next ETF is a technology-focused fund, the Fidelity® MSCI Information Technology Index ETF (NYSE:FTEC) that gives exposure to US companies in the IT sector. The pandemic has meant the acceleration of technology adoption, benefitting many IT names, which have become popular amidst the rally in the market.

FTEC, which has 331 holdings, started trading in October 2013. The benchmark index is the MSCI USA {{0|IMI)) Information Technology 25/50 Index.
The top 10 stocks make up about 58% of assets under management of almost $5 billion. Apple has the top spot, with 20.90%, followed by Microsoft (15.61%). Thus, changes in the price of either stock affect the price of the fund. No other share currently has a weighting of over 3.6%.
Several other well-known names in FTEC include Visa (NYSE:V), NVIDIA (NASDAQ:NVDA), Mastercard (NYSE:MA) and Adobe (NASDAQ:ADBE). Over the past year, FTEC has returned about 40%. Trailing P/E and P/B ratios stand at 33.84 and 9.25, respectively. These numbers suggest the ETF has become expensive on a historical basis.
The industry is likely to be volatile around the earnings reporting season that is upon us. However, IT shares have pushed the market to record highs in previous years. Many analysts concur that increased digitalization, one of the developments of the global pandemic, is here to stay.
Therefore, we expect technology to be a top-performing sector in this decade, too. Potential investors could consider buying the dips in FTEC, especially if there is a decline toward $95 in the coming weeks.
