Another day, another ETF anniversary celebrated. This time, it’s the Invesco Equal-Weight S&P 500 ETF (RSP), which made its debut on April 24th, 2003, making it 20 years old as of last month. Currently, RSP stands at around $33 billion in assets under management, or AUM.
According to the ETF Central Screener, RSP has seen around -$645 million in inflows leave over the last month as of May 8th, 2023. This was likely due to the recent surge in regular market cap-weighted indexes thanks to strong tech sector earnings, which investors are likely chasing.
That being said, the ETF remains a powerhouse in the equal-weighted index ETF space thanks to Invesco's strong brand name recognition and its economy of scale.
Here's all you need to know about RSP and how it stacks up against a regular market cap-weighted S&P 500 ETF.
RSP Methodology Explained
When it comes to indexing, the majority of ETF providers pick the market cap-weighted approach. Under this method, stocks included in an index are weighted proportionally to their market capitalization, which is the product of the share price and the number of outstanding shares.
As a result, stocks with higher market capitalizations carry more weight and have a greater impact on the index's performance. An example would be the popular SPDR S&P 500 ETF (SPY (NYSE:SPY)). SPY's current two top holdings are Apple (NASDAQ:AAPL) and Microsoft (NASDAQ:MSFT), which account for 7.46% and 6.69% of the ETF respectively.
While this approach offers benefits such as low portfolio turnover, it can lead to issues with concentration, particularly in terms of market cap size and sector. For example, SPY's top 10 mega-cap stocks currently account for 28.17% of the ETF's total weight, while its tech sector exposure clocks in at 26.10%.
In contrast, equal-weight ETFs like RSP do exactly as their name suggests – hold every stock, regardless of their market cap weight, in equal proportions. Therefore, as one of the 500 stocks in the S&P 500 index, Apple would receive a weight of around 0.20% in an equal-weight ETF.
This methodology leads to some interesting differences. In terms of style, RSP is more evenly distributed between blend, value, and growth stocks, whereas the regular S&P 500 is more growth-focused right now. RSP also allocated far more to mid-cap stocks, which the regular S&P 500 neglects somewhat.
There are some downsides. Chief among them is a higher portfolio turnover rate due to the quarterly rebalancing needed to keep weightings in check. As a result, RSP sports a higher expense ratio of 0.35% compared to SPY's 0.09%. The question is – has the equal-weight strategy been worth this fee?
RSP Historical Performance
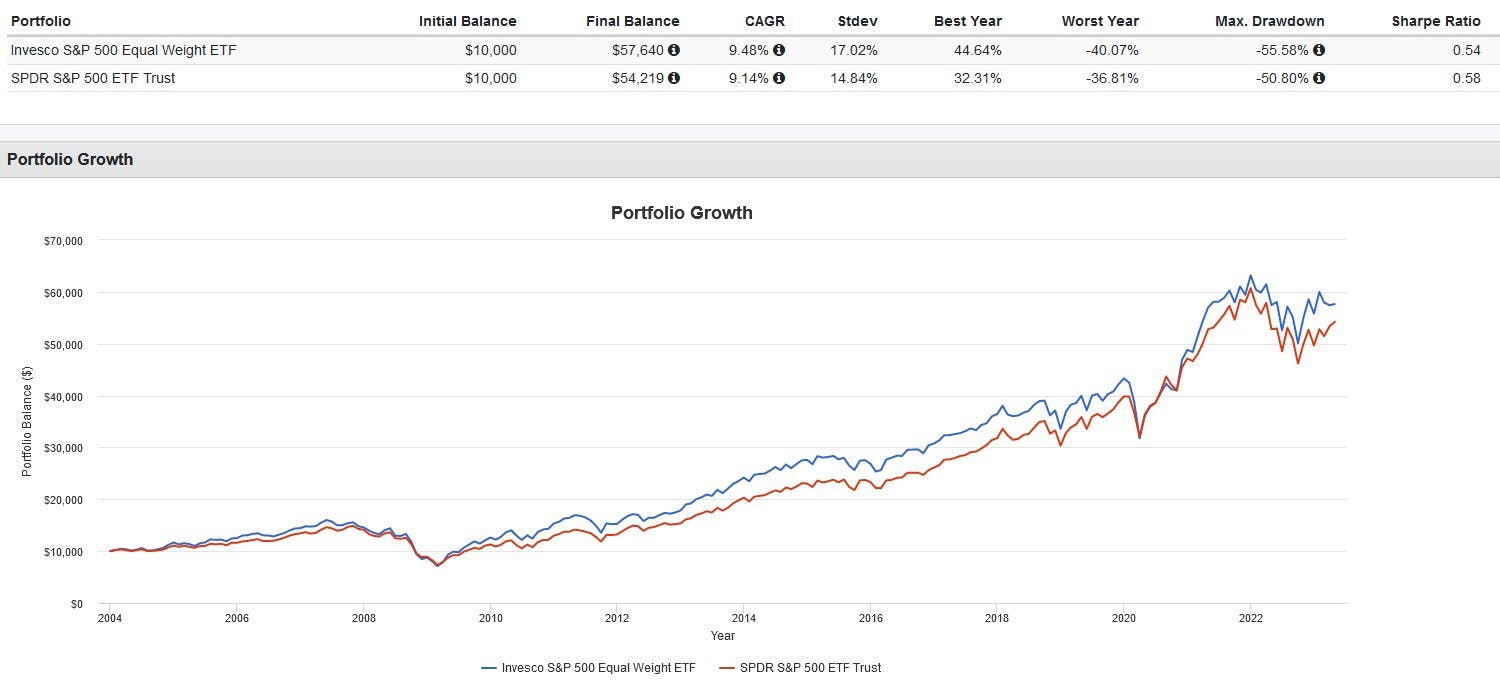
Keep in mind that this backtest is hypothetical in nature, does not reflect actual investment results and is not a guarantee of future results. It also does not account for trading commissions and bid-ask spreads.


Historically, RSP has eked out a better return than SPY, at the cost of higher volatility and drawdowns. On a rolling basis, the latter squeaked out a minor advantage over a 15-year period.
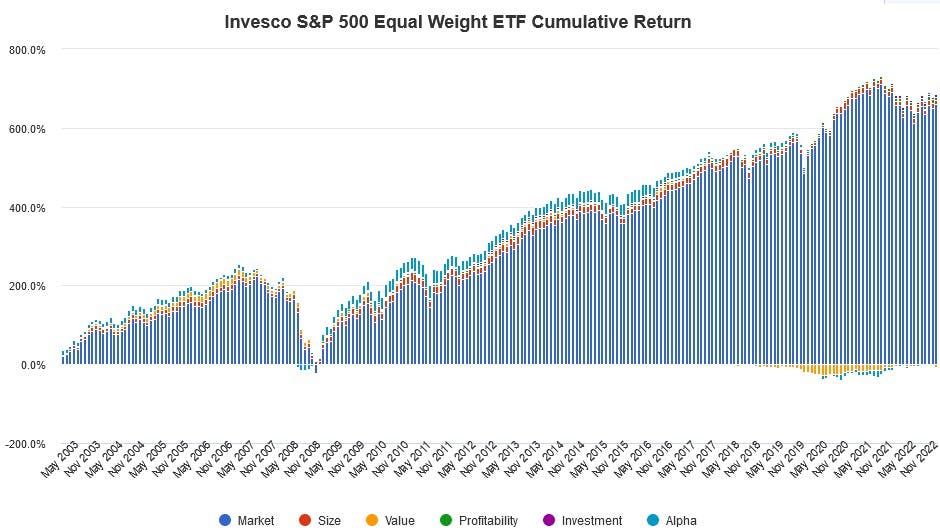
To examine this further, I conducted a factor regression of both RSP and SPY for exposure to the five Fama-French factors: market (Rm-Rf), size (SmB), value (HmL), profitability (RmW), and investment (CmA), respectively, to understand what drove differences in their returns.
The results showed that RSP had a minor, but statistically significant, loading to size and value. That is, the equal-weighting methodology provided greater exposure to smaller stocks that traded at lower valuations. This isn't surprising considering how RSP has a higher weighting to mid-caps and more value-oriented sectors like industrials and financials.

Here's an interesting graph showing the cumulative contributions (or detractions) from each factor's returns. You can clearly see how from 2019 to 2021, RSP's exposure to the value factor (yellow bars) caused some underperformance, right as growth-oriented tech stocks surged. SPY, being market cap- weighted did not have this problem.

Over a longer period, I do expect RSP to outperform slightly (gross of fees) due to its higher size and value exposure, both of which are factors that have historically contributed to market outperformance. The worry is that the 0.35% expense ratio might eat up any alpha generated.
The other question is whether or not the equal-weight methodology is worth the higher cost versus just pairing SPY with individual small-cap and value factor ETFs, or even a dedicated small-cap value ETF altogether. This approach could result in greater factor exposure and a lower weighted expense ratio.
Still, the value proposition of RSP is clear – for a 0.35% expense ratio, investors can index 500 of the leading firms in the US and be agnostic as to which one does best, while receiving a more proportional representation of market cap sizes and sectors.
This content was originally published by our partners at ETF Central.
