Leveraged and inverse ETFs have surged in popularity across Europe and the US over the past decade. Investors flock to these ETFs for their potential to amplify returns, hedge against market downturns, offer trading flexibility, and diversify tactical allocations. In this edition of the ETFs Charted newsletter, we dive into their growth, product range, performance, and leading players on both sides of the Atlantic.
The Offerings
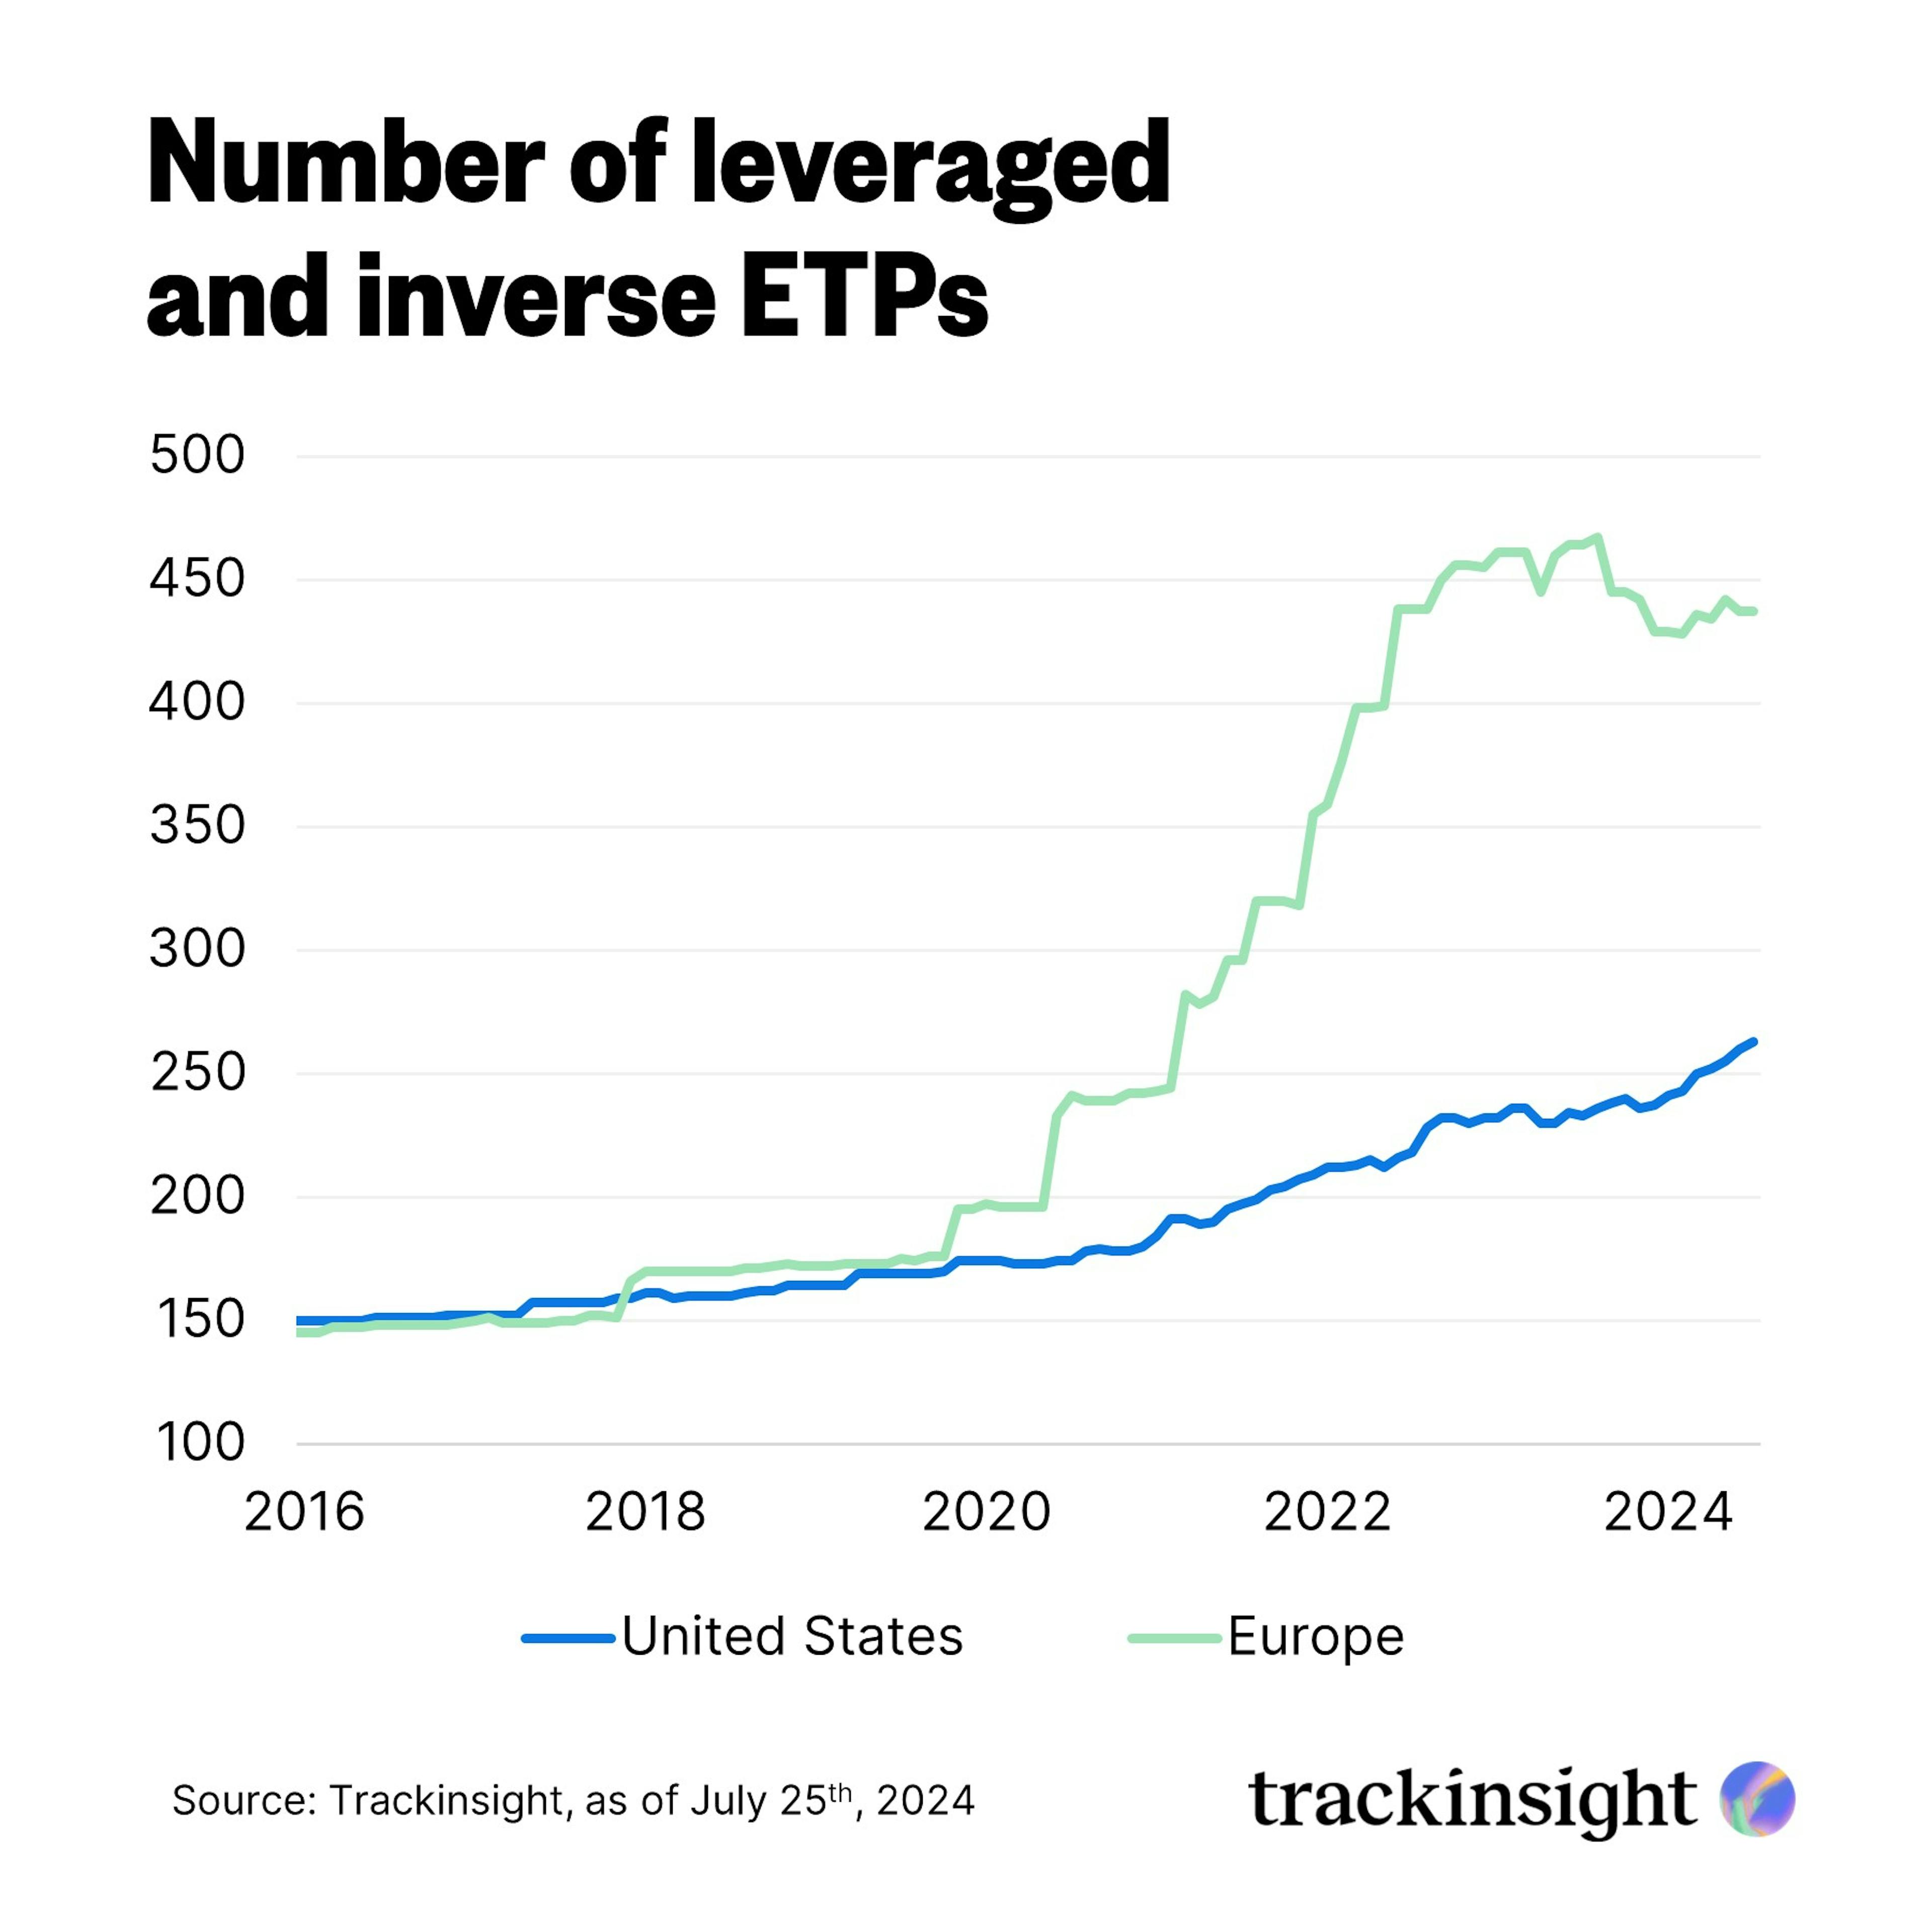
Europe has launched significantly more leveraged and inverse ETPs compared to the US, especially since mid-2020 during the pandemic.
The Assets
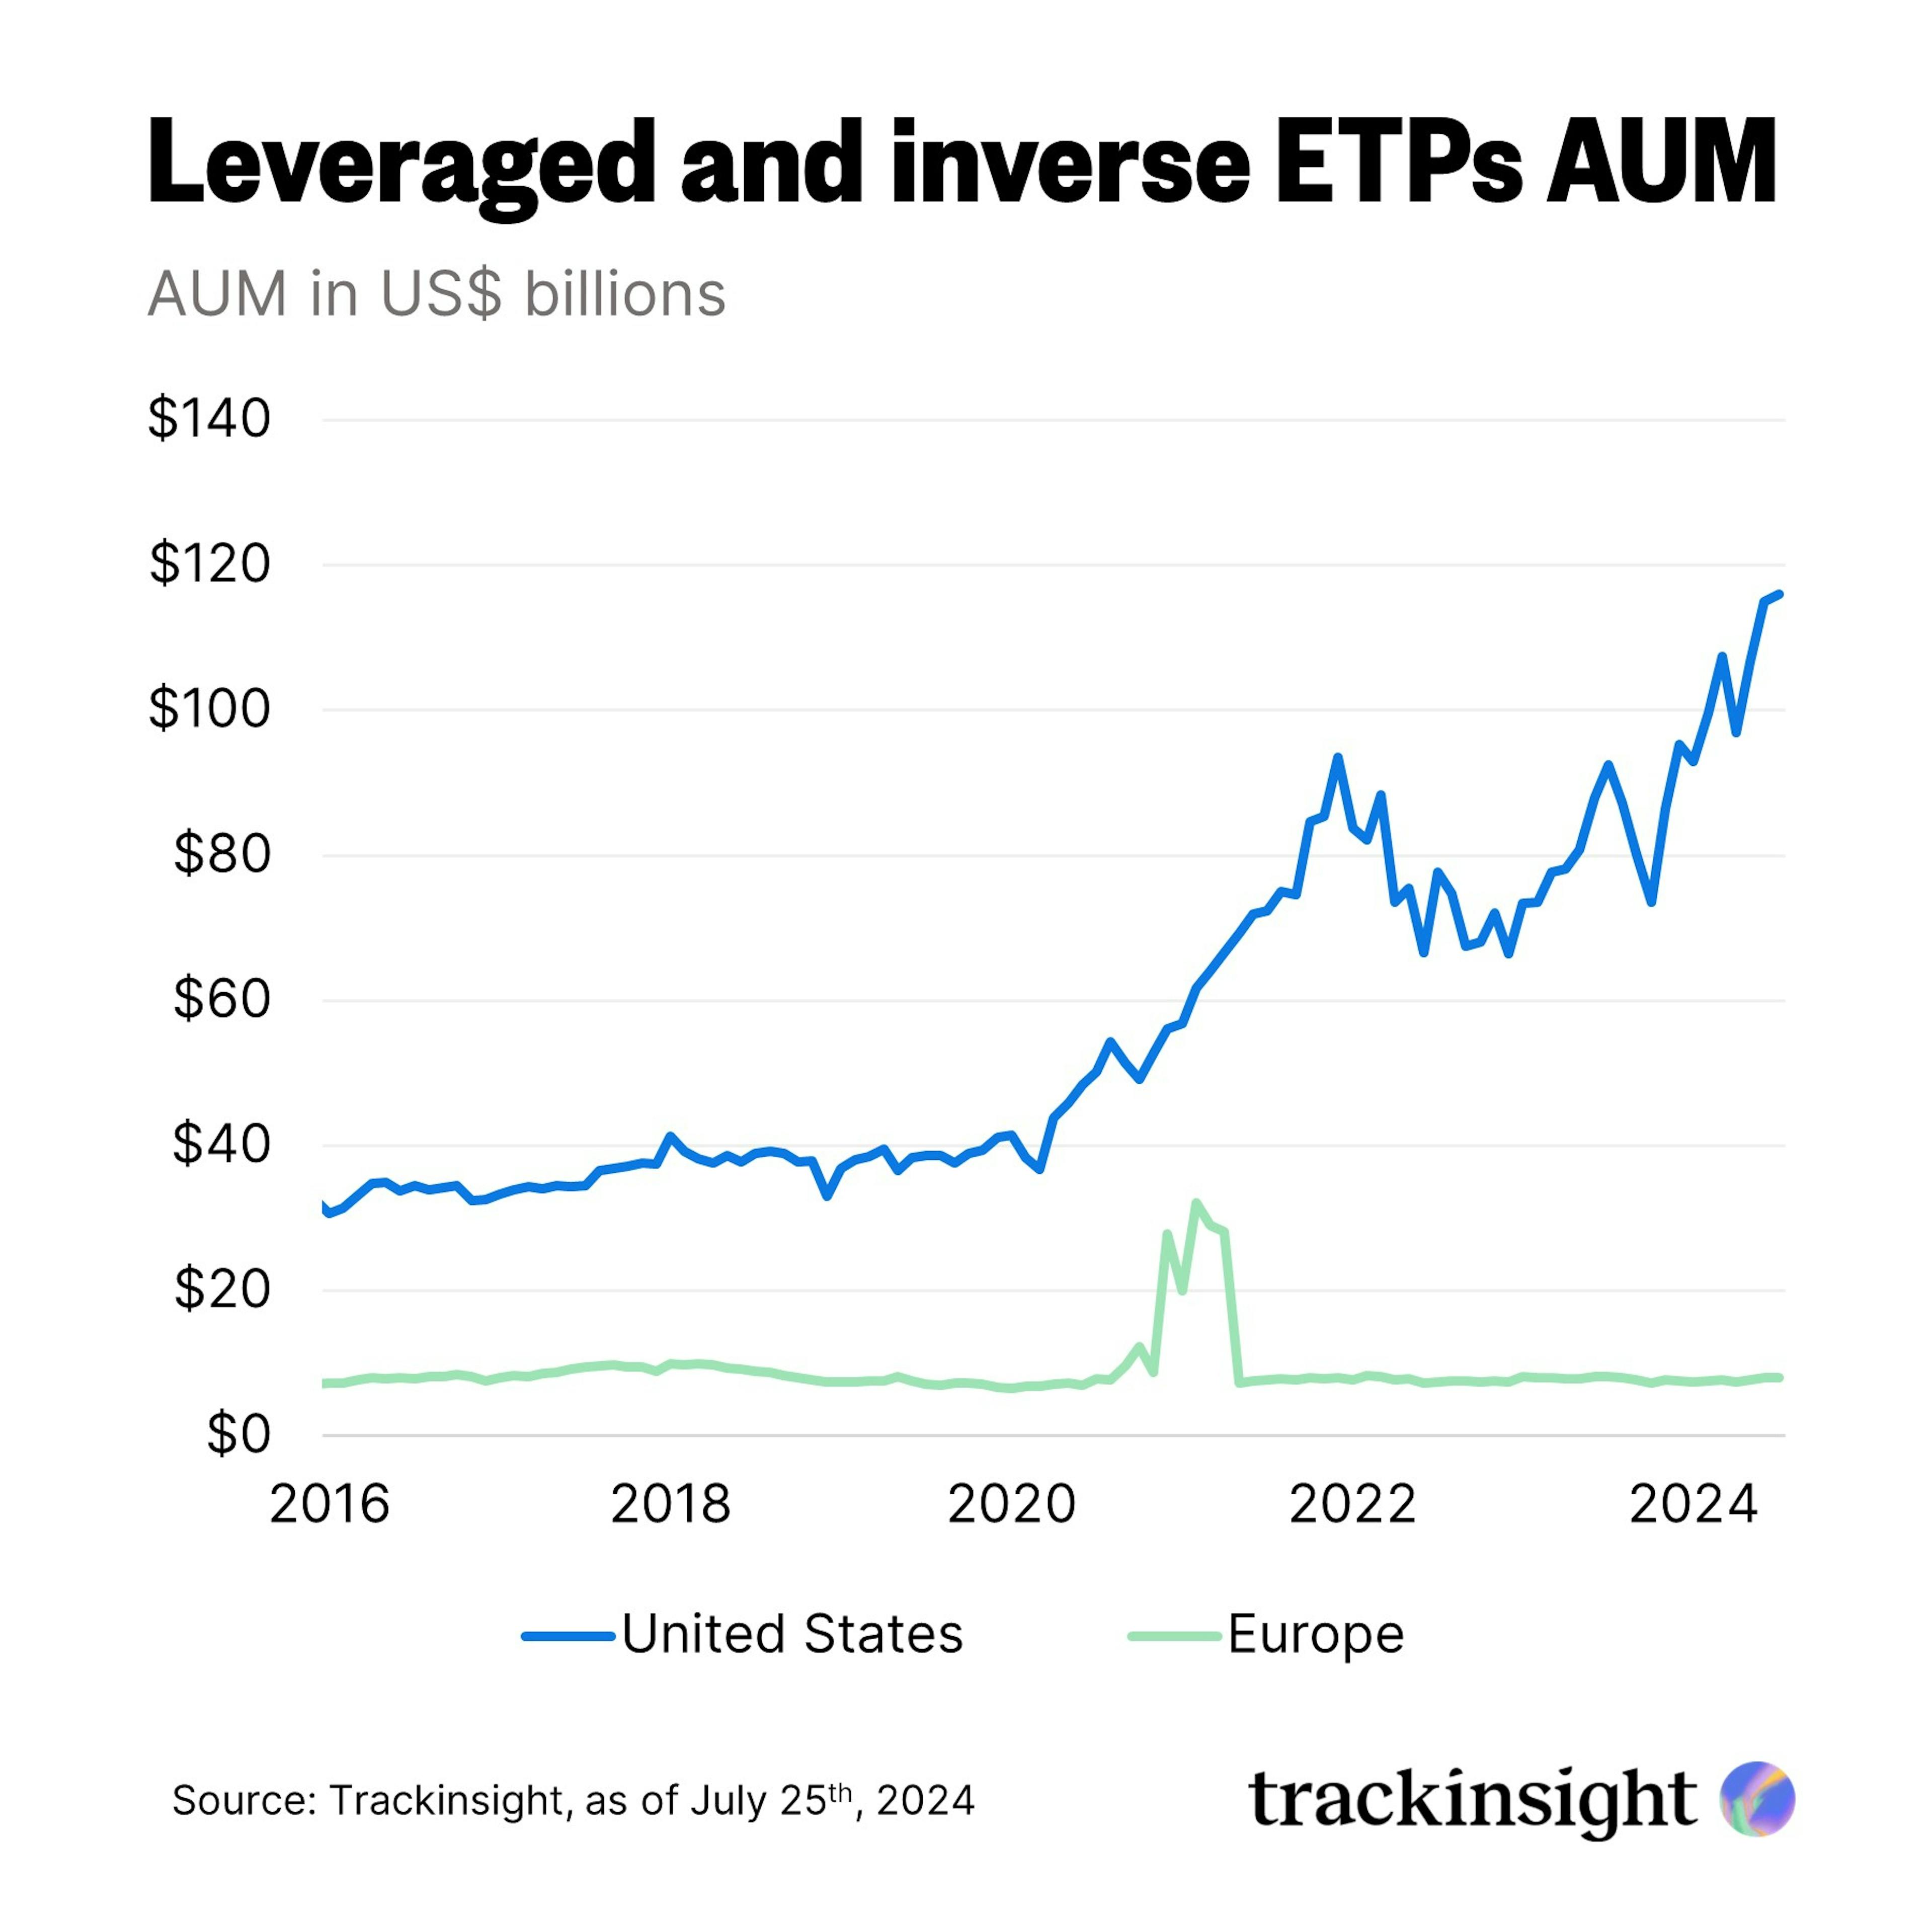
Leveraged and inverse ETFs have seen a dramatic divergence in growth between the US and European markets. While US AUM in this category have surged steadily, nearing $120 billion, Europe has experienced much flatter growth, fluctuating between $7 and $9 billion. A brief spike in late 2020 and early 2021 was followed by a return to this range.
Breakdown by Asset Class
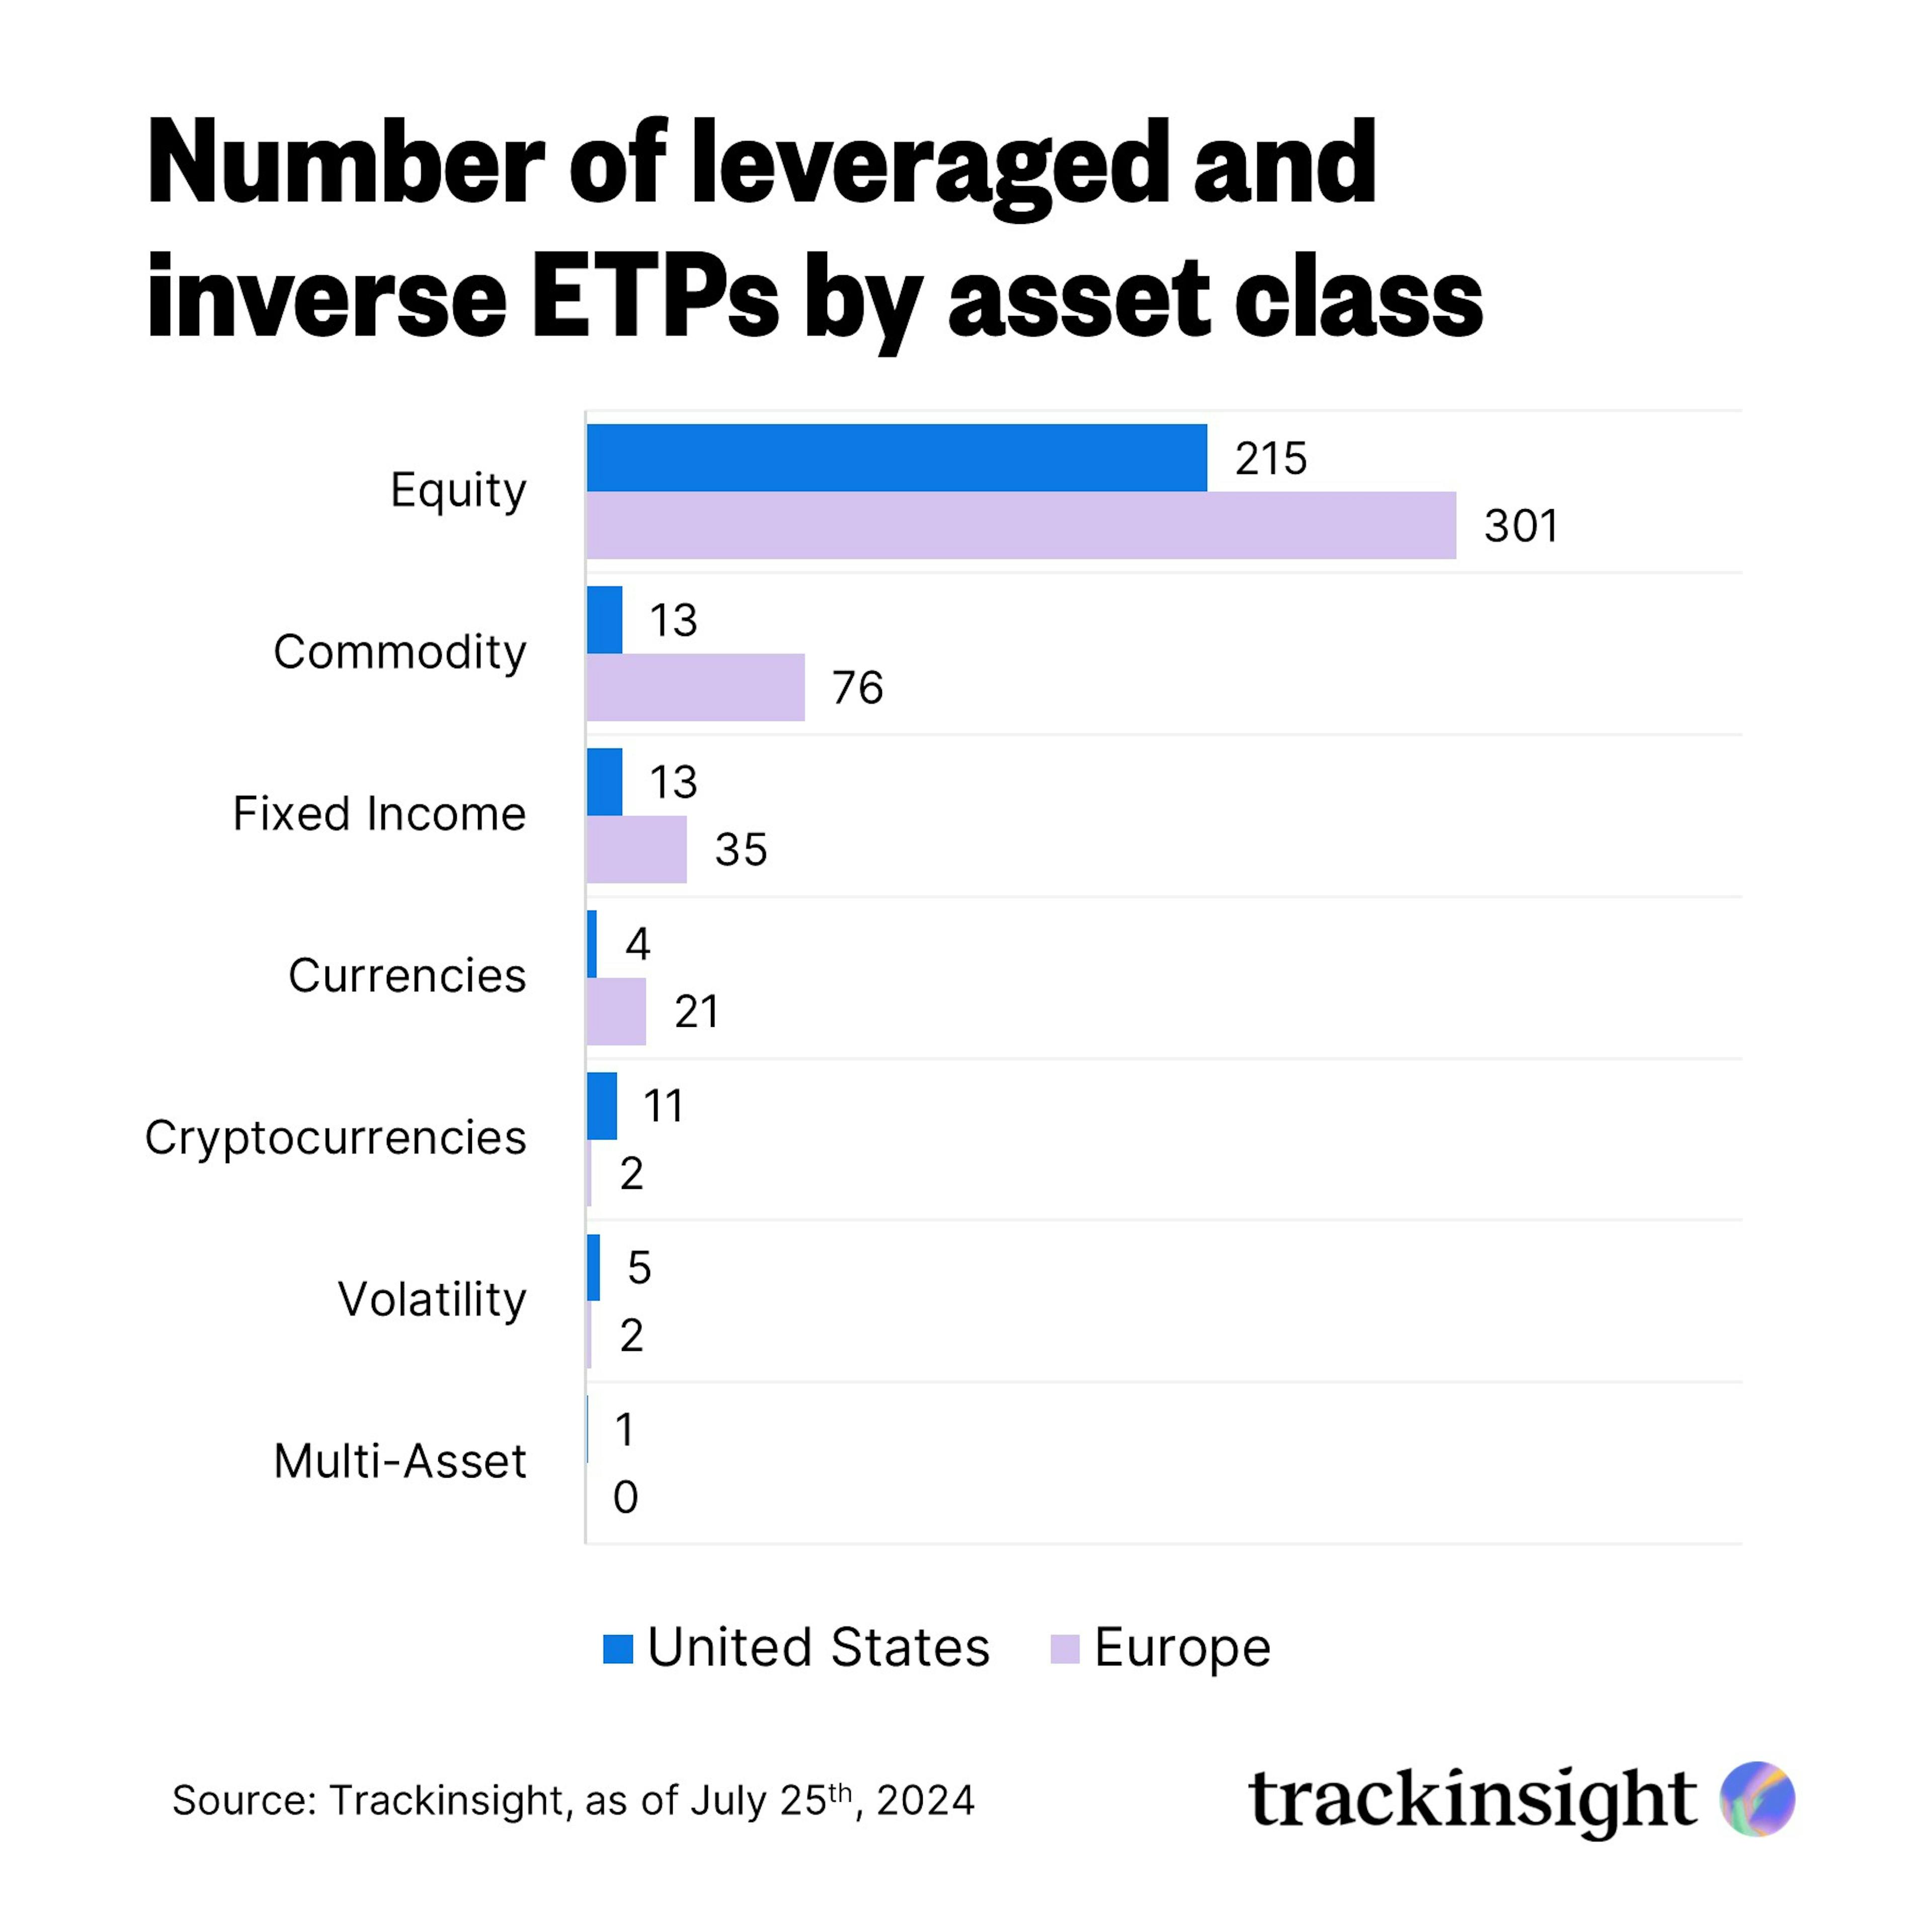
Equity ETFs dominate both regions, while Europe boasts a wider range of leveraged and inverse ETFs across asset classes like fixed income, commodities, and currencies compared to the USA, which has a stronger presence in cryptocurrency and volatility ETFs.
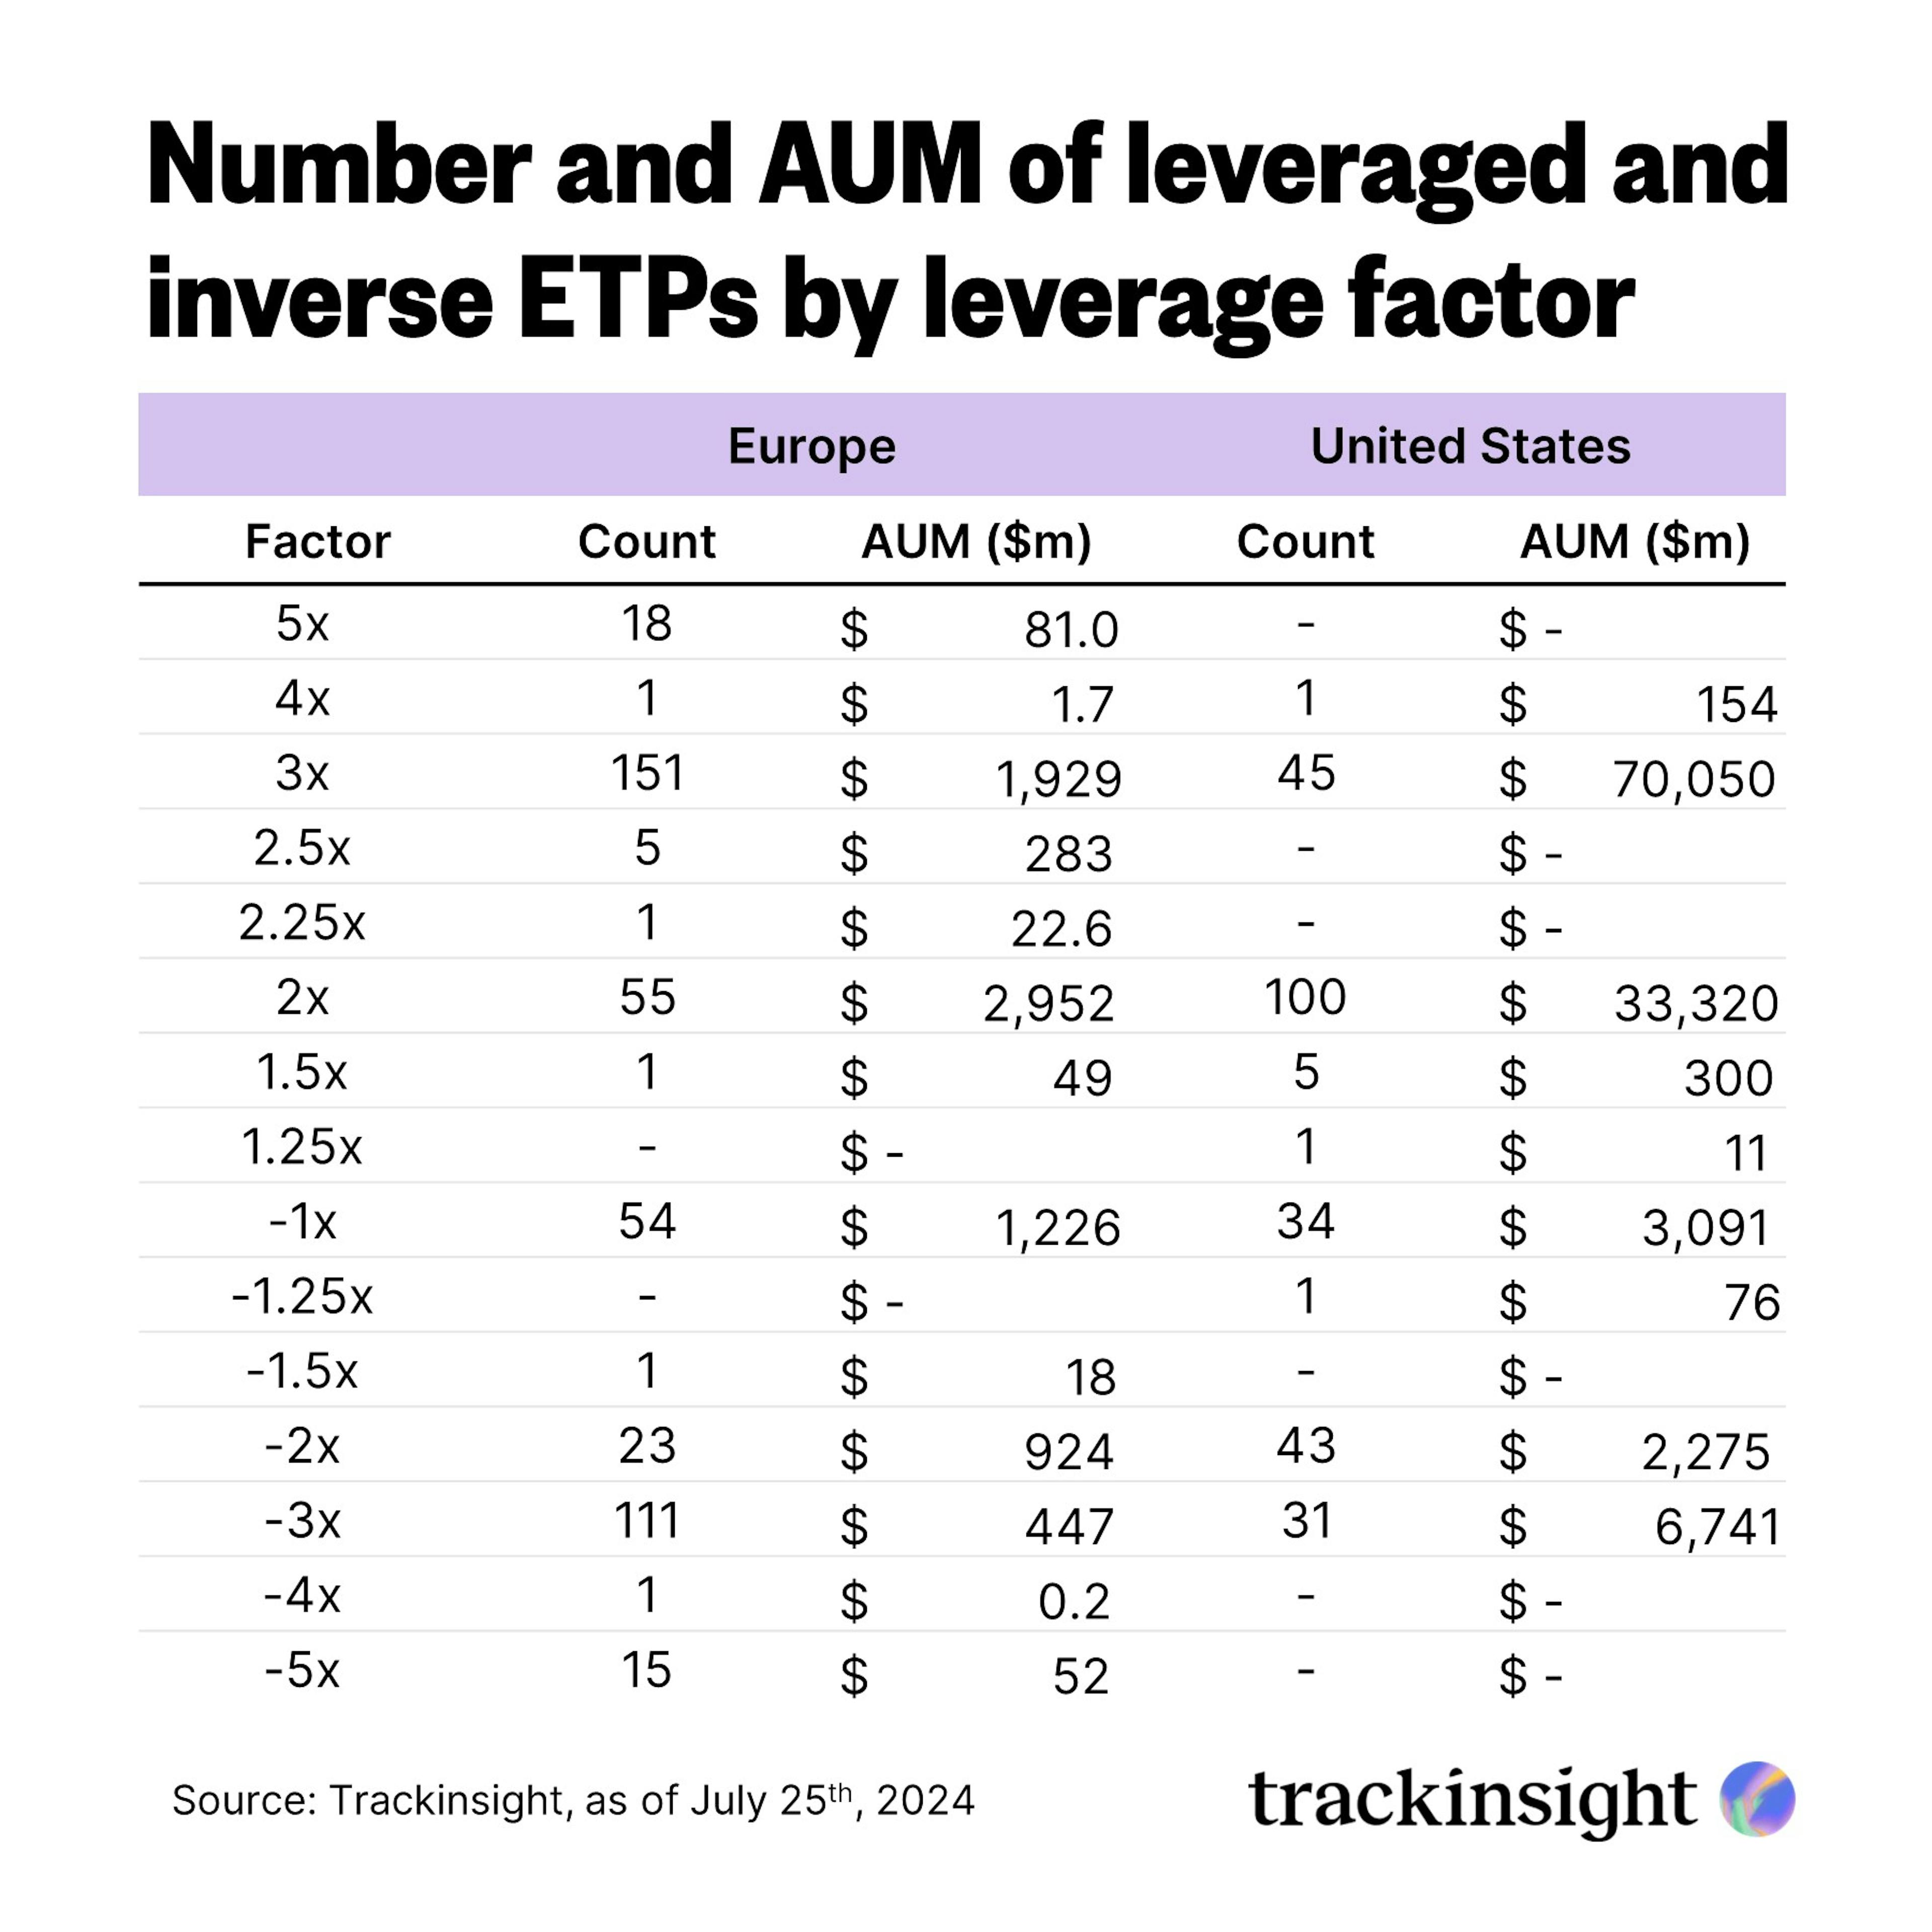
Europe offers a broader variety of leveraged and inverse ETFs, particularly in the 3x category with 151 products ($1,929 million AUM) and significant numbers in inverse categories like -1x and -3x. However, the U.S. leads in assets, especially in 3x ETFs (45 products, $70,050 million AUM) and 2x ETFs (100 products, $33,320 million AUM).
In the inverse category, the U.S. also has higher AUM, particularly for -1x and -3x ETFs.
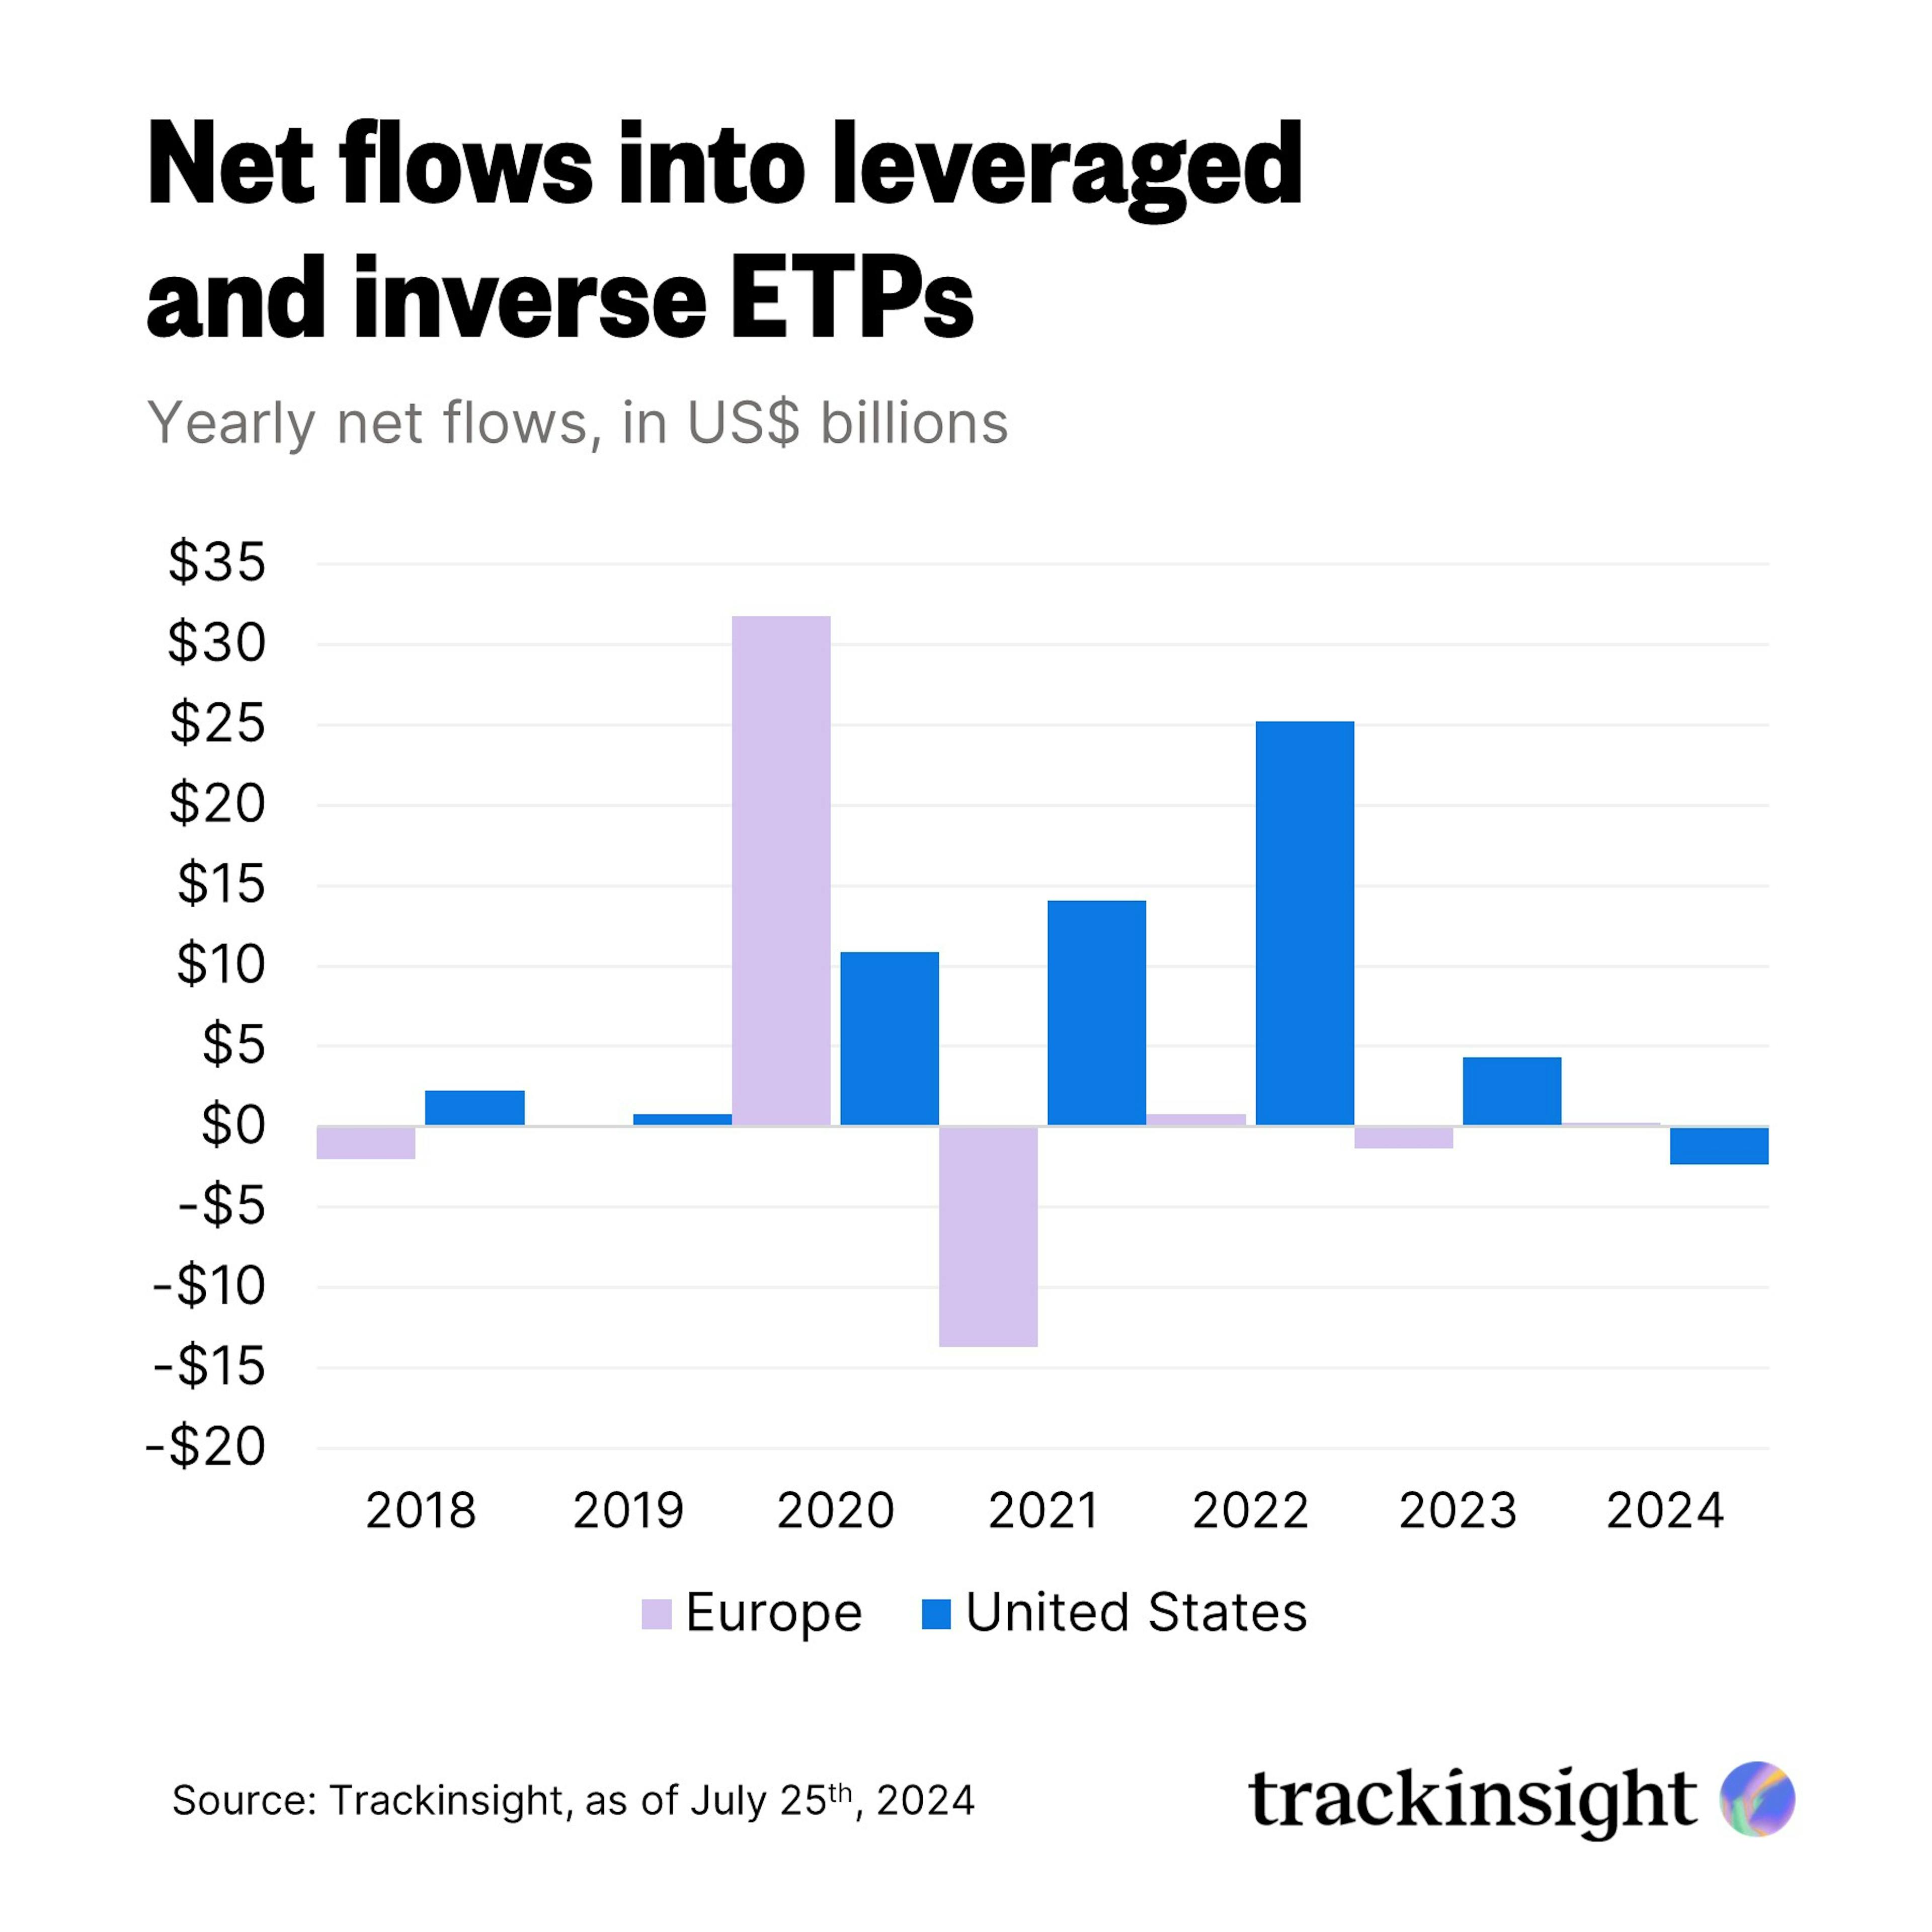
Net inflows into leveraged and inverse ETFs in the U.S. have significantly tapered off after a robust period between 2020 and 2022. The trend has reversed in 2023, with net outflows reaching -$2.37 billion thus far. In contrast, European markets have exhibited more volatile net flows in these ETF categories over the years.
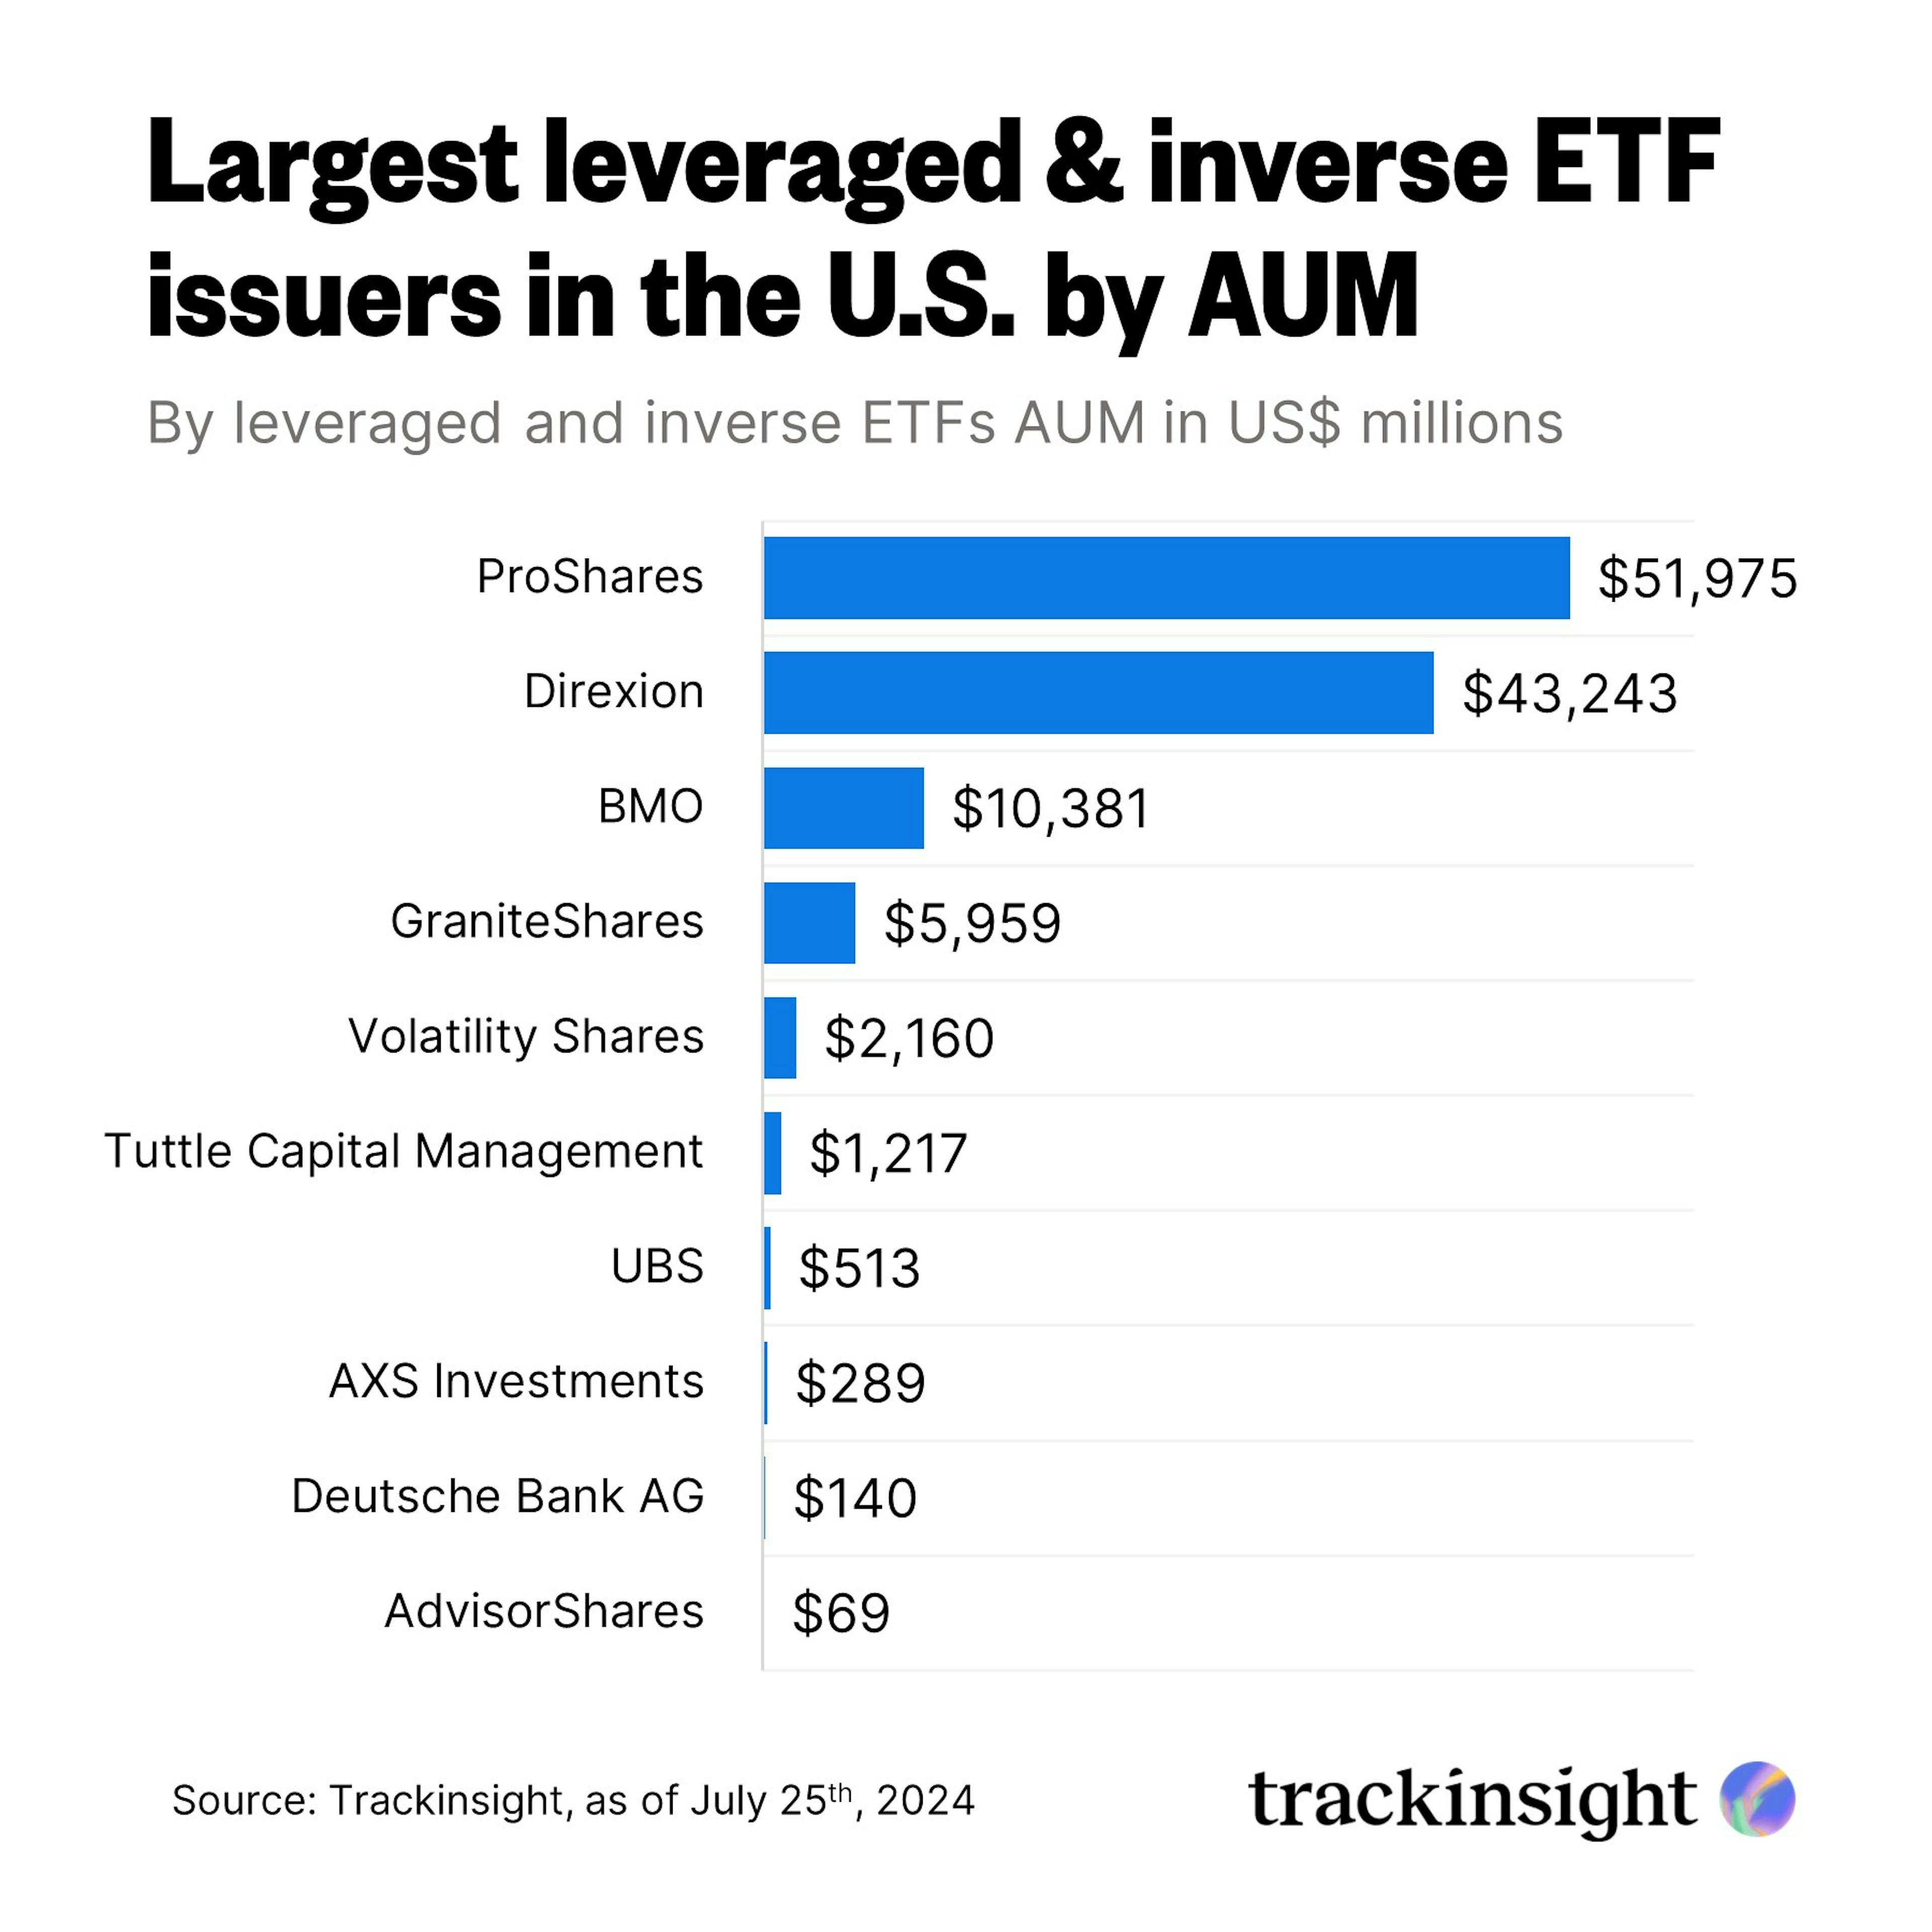
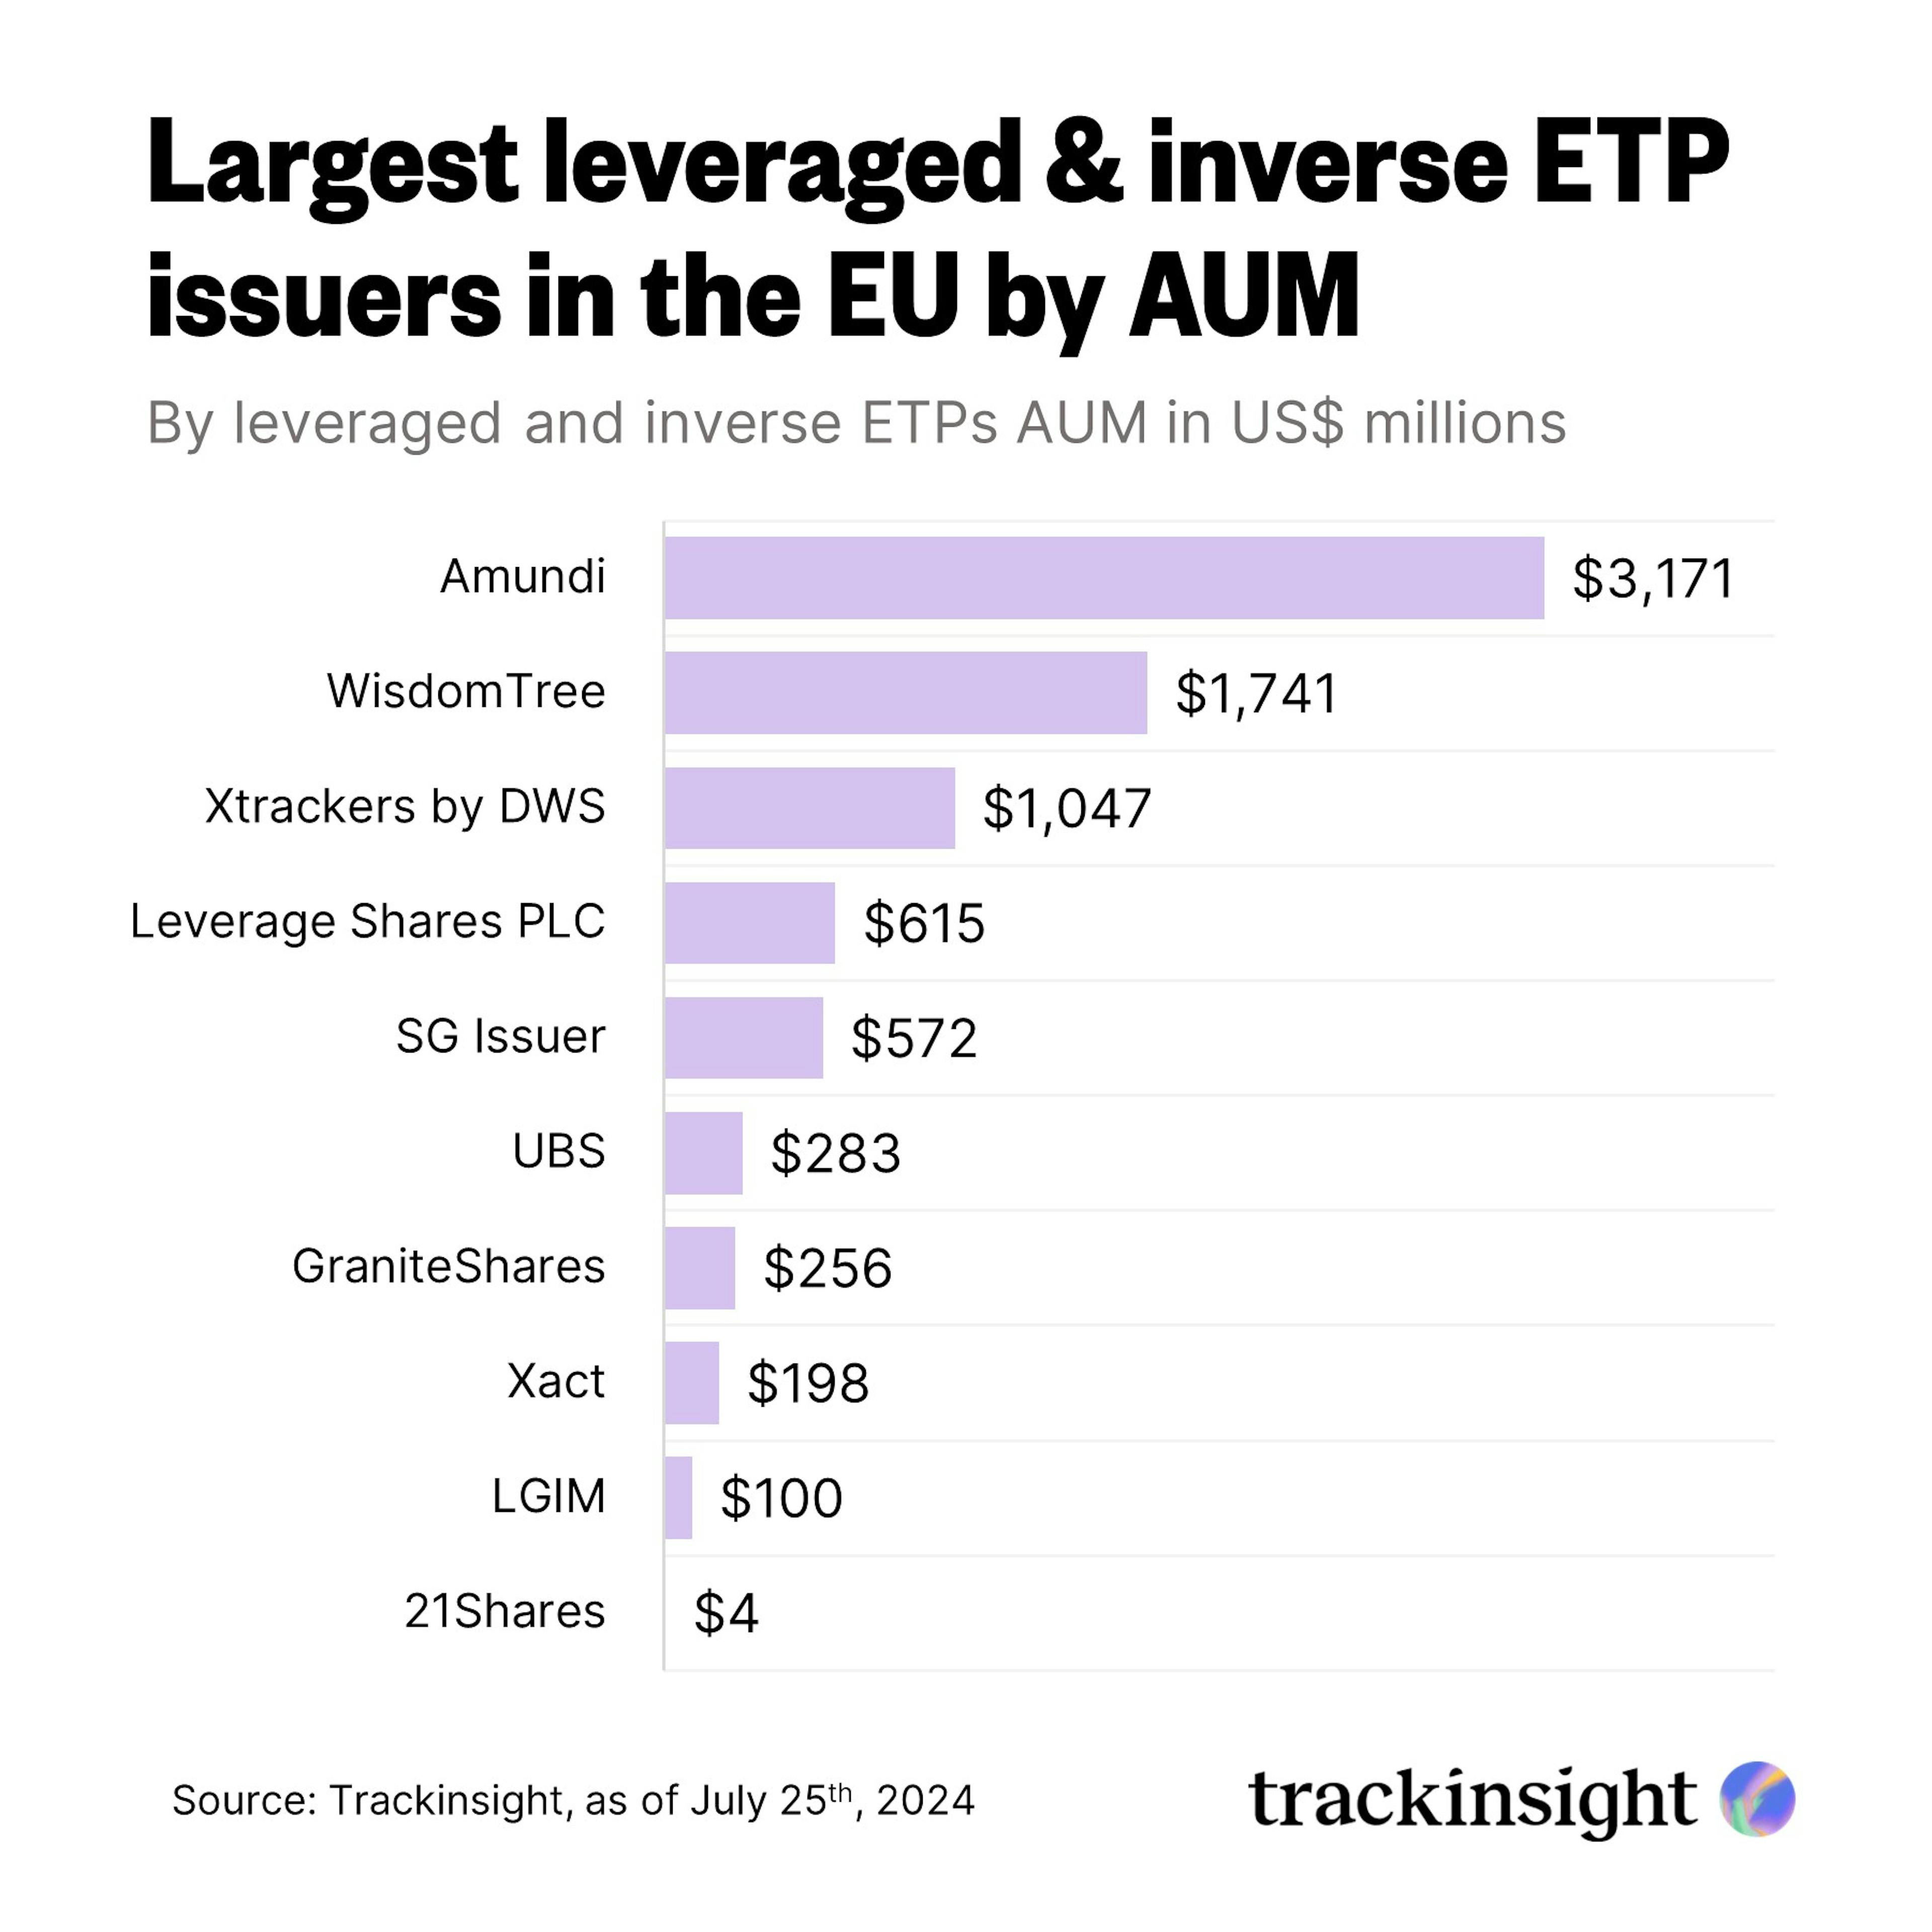
The following two charts shows the largest issuers of leveraged and inverse ETFs in Europe and the United States.
Which stock to consider in your next trade?
AI computing powers are changing the Canadian stock market. Investing.com’s ProPicks AI are winning stock portfolios chosen by our advanced AI for Canada, the US, and other exciting markets around the globe. Our top strategy, Tech Titans, nearly doubled the S&P 500 in 2024 - one of the most bullish years in history. And Beat the TSX, designed for broad market exposure, is showing +878% gains with 10 years’ back-tested performance. Which Canadian stock will be the next to soar?
Unlock ProPicks AI
